
Swiss Federal Institute for Forest, Snow and Landscape Research
L o a d i n g
The Swiss Federal Institute for Forest, Snow and Landscape Research is concerned with the use, development and protection of natural and urban spaces. The focus of their research is on solving problems to do with the responsible use of landscapes and forests and a prudent approach to natural hazards, especially those common in mountainous countries.
Available DatasetsShowing 610 of 610 results
- The data file refers to the data used in Portier et al. "Plot size matters: towards comparable species richness estimates across plot-based inventories" (2022) *Ecology and Evolution*. This paper describes a methodoligical framework developed to allow meaningful species richness comparisons across plot-based inventories using different plot sizes. To this end, National Forest Inventory data from Switzerland, Slovakia, Norway and Spain were used. NFI plots were aggregated into mega-plots of larger sizes to build rarefaction curves. The data stored here correspond to the mega-plot level data used in the analyses, including for each country the size of the mega-plots in square meters (A), the corresponding species richness (SR) as well as all enrionmental heterogeneity measures described in the corresponding paper. Mega-plots of country-specific downscaled datasets are also provided. The raw data from the Swiss NFI can be provided free of charge within the scope of a contractual agreement (http://www.lfi.ch/dienstleist/daten-en.php). Contact details for data requests from all NFIs can be found in the ENFIN website (http://enfin.info/).12 years ago
- This dataset contains literature data for snow density and frequency dependency of speed of sound waves in snow. The data were either available as tabular data in the original publications or were digitized from plots contained in the original publications. The data were originally collected and used for first figure in Capelli et al. (2016) .102 years ago
- This dataset contains the Fire Weather Index for Hydrological Bavaria from 1980 - 2099 as stated in the paper "Climate change impacts on regional fire weather in heterogeneous landscapes of Central Europe" published in Natural Hazards and Earth System Sciens (NHESS) 2023. The dataset contains daily Fire Weather Index values for all 50 members (subfolders of the dataset) of the CRCM5-LE (11 km spatial resolution) from 1980 to 2099 over the domain of Hydrological Bavaria. Please cite this dataset as the publication: Miller, J., Böhnisch, A., Ludwig, R., & Brunner, M. I. (2023). Climate change impacts on regional fire weather in heterogeneous landscapes of Central Europe. Natural Hazards and Earth System Sciences Discussions, 1-25. doi: 10.5194/nhess-2023-51.12 years ago
- High quality meteorological data are needed for long-term forest ecosystem research, particularly in the light of global change. The long-term data series published here comprises almost 20 years of measurements for one meteorological station in Lens in Switzerland which is located within a natural coniferous forest with Scots pine (_Pinus sylvestris_; 150-170 yrs)) as dominant tree species. The meteorological time series are presented in hourly time resolution of air temperature, relative humidity, precipitation, photosynthetically active radiation (PAR) and wind speed. Lens is part of the Long-term Forest Ecosystem Research Programme (LWF) established and maintained by the Swiss Federal Research Institute WSL.32 years ago
- This dataset contains surface datasets (in particular canopy structure fields) and meteorological input (water years 2016-2021) required to run the snow model FSM2 over the Fluela valley. Land surface datasets are available for a 1.5x2.5km model domain at 2m spatial resolution, meteorological input at hourly resolution is provided for a point and corresponds to the location of the automatic weather station / snow measurement field 5DF in Davos. Corresponding FSM2 simulations are used and analyzed in the publication 'Canopy structure, topography and weather are equally important drivers of small-scale snow cover dynamics in sub-alpine forests' by Mazzotti et al. (submitted to HESSD). This publication should be cited whenever the dataset is used.22 years ago
- L'objectif de ce livre blanc est de fournir aux décideurs, aux administrations et aux parties prenantes les résultats de recherche les plus récents afin de promouvoir l'utilisation optimale de la bioénergie issue des engrais de ferme dans la transition énergétique suisse. A cette fin, les résultats du centre de compétence suisse pour la recherche en bioénergie - SCCER BIOSWEET - sont résumés et présentés dans un contexte plus large. Si rien d'autre n'est mentionné, les résultats se réfèrent à la Suisse et, dans le cas de la matière première, aux potentiels nationaux de biomasse.12 years ago
- 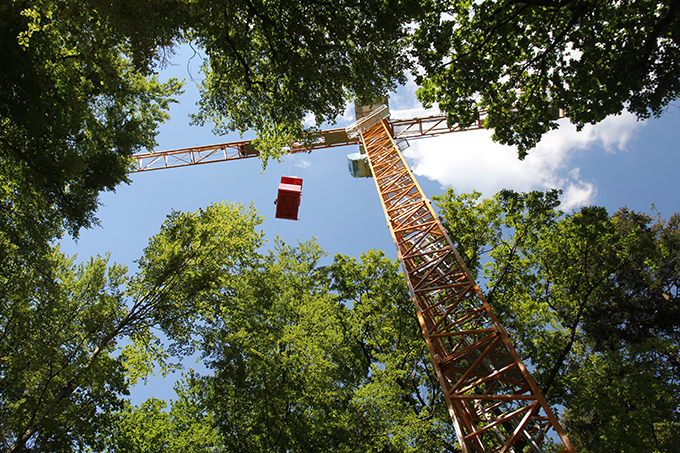 This research site is located near Hölstein in Canton Basel-Landschaft in a mature temperate forest that harbours more than 400 trees from 14 different species. The 1.6 ha site is equipped with the latest infrastructure, including 60 automated point dendrometers, automated soil respiration chambers, 72 ceramic suction cups at various locations and depths across the site, and a range of automated environmental sensors in the soil, the forest floor and in the canopy. A key piece of infrastructure is the new Swiss Canopy Crane II (SCC II), a 50 m tall crane with a 50 m jib that provides canopy access to 250 trees from 12 different species.32 years ago
- Volume of stemwood with bark of all trees and shrubs starting at 12 cm dbh that were removed from the forest as a result of damage occurring (e.g. windthrow, avalanches, insects, rockfall), and not because of management planning. This theme is derived on the level of a sample plot from the cuttings of the sample trees and the salvage cut proportion (according to information from the forester). *In the calculation no D7/tree height data were used. The values calculated like this have not been corrected for bias, but allow for cantons or forest districts a more robust estimation of changes and could thus be better interpreted. __Citation:__ > _Abegg, M.; Brändli, U.-B.; Cioldi, F.; Fischer, C.; Herold-Bonardi, A.; Huber M.; Keller, M.; Meile, R.; Rösler, E.; Speich, S.; Traub, B.; Vidondo, B. (2014). Fourth national forest inventory - result tables and maps on the Internet for the NFI 2009-2013 (NFI4b). [Published online 06.11.2014] Available from World Wide Web http://www.lfi.ch/resultate/ Birmensdorf, Swiss Federal Research Institute WSL. [doi:10.21258/1057112](https://doi.org/10.21258/1057112)_22 years ago
- Two stem core samples of all trees of a subplot of approximately 1 a. Basal Area, Wood volume increment per area estimation ### Purpose: ### Investigation of the relation between dendroparameters of dominance/surpression and stem growth. Abgleich Jahrringdaten mit Inventurdaten. ### Paper Citation: ### * Nehrbass-Ahles C, Babst F, Klesse S, Nötzli M, Bouriaud O, Neukom R, Dobbertin M, Frank D (2014) The influence of sampling design on tree-ring-based quantification of forest growth. Global Change Biology, 20 (9): 2867–2885. [doi: 10.1111/gcb.12599](http://doi.org/10.1111/gcb.12599) * Klesse S, Etzold S, Frank D (2016) Integrating tree-ring and inventory-based measurements of aboveground biomass growth: research opportunities and carbon cycle consequences from a large snow breakage event in the Swiss Alps. European Journal of Forest Research, 135 (2): 297-311.12 years ago
- Sum of the stem cross-section areas of all living and dead trees and shrubs starting at 12 cm dbh at a height of 1.3 m (dbh measurement height). __Citation:__ > _Abegg, M.; Brändli, U.-B.; Cioldi, F.; Fischer, C.; Herold-Bonardi, A.; Huber M.; Keller, M.; Meile, R.; Rösler, E.; Speich, S.; Traub, B.; Vidondo, B. (2014). Fourth national forest inventory - result tables and maps on the Internet for the NFI 2009-2013 (NFI4b). [Published online 06.11.2014] Available from World Wide Web http://www.lfi.ch/resultate/ Birmensdorf, Swiss Federal Research Institute WSL. [doi:10.21258/1057112](https://doi.org/10.21258/1057112)_32 years ago
- We present stated preference data for improved forest management measures from seven Swiss municipalities in the Cantons of Grisons and Valais. The data was collected between October 2019 and February 2020 using an online questionnaire. We invited 10289 households to participate and received 939 responses. The online questionnaire consisted of two main parts: (i) an online choice experiment and (ii) questions on the sociodemographic characteristics of the responding households. The choice experiment confronted households with twelve consecutive choice tasks. Each choice task consisted of three options with a varying degree of avalanche and rock fall risk reduction due to improved forest management. The options further differed with respect to the way the costs for the improved forest management are allocated and the way they are calculated. We additionally provided each of the options with a cost attribute, allowing for the calculation of willingness to pay measures. At the end of the choice experiment we asked five de-briefing questions and eight attitudinal questions. Additionally, we asked the responding households to state their willingness to take risks. The sociodemographic characteristics collected in the second part of the questionnaire allow for an analysis of the impact they have on the choices we observed in the first part of the questionnaire.32 years ago
- Understanding the market behavior of forest owners and managers is important to identify effective and efficient policy instruments that enhance wood provisioning. We conducted a choice experiment (CE) at two study sites in south-eastern Germany (Upper Bavaria and Lower Franconia) and two in north-eastern Switzerland (Grisons and Aargau) to elicit foresters’ preferences for different supply channels, contract lengths, wood prices and duration of business relations. CE belong to the stated preference methods to analyze individual decision making. Respondents had to choose among three options based on different attribute levels in 12 consecutive choice sets. Our study site comparison identified regional differences and particularities, which should be taken into account when promoting wood mobilization. The success of policy instruments, such as the promotion of bundling organizations and long-term contracts, can vary depending on the specific structural and institutional conditions, like existing marketing channels, as well as on behavioral aspects of the particular public and private decision makers.82 years ago
- The files refer to the data and R code used in Mey et al. "From small forest samples to generalised uni- and bimodal stand descriptions" (2021) _Methods in Ecology and Evolution_. __Generalised stand descriptions__ are coming from the simultaneous examination of samples that are representative for a specific target area (here, Switzerland) and link available information about forest stand attributes. They combine the modelling of uni- or bimodal diameter distributions and species compositions, i.e. the shares of stems of individual species. Generalised stand descriptions may be used to interpret tree species diversity, regeneration and harvest potentials on a plot-level basis, and to initialise forest models with representative stand data. The data stored here were derived from the fourth campaigns of the Swiss National Forest Inventory (NFI). The raw data from the Swiss NFI can be provided free of charge within the scope of a contractual agreement (http://www.lfi.ch/dienstleist/daten-en.php). --------------------------------------- The file 'Data Figures 2 and 4' is publicly available and contains the data used to produce the Figures 2 and 4 published in the paper. The files 'Data diameter modelling' and 'Data species modelling' contain all the data required to reproduce the diameter and species model building. The access to these two files is restricted as they contain raw data from the fourth Swiss NFI, submitted to the Swiss law and only accessible upon contractual agreement. The files 'Script diameter and species modelling' and 'Functions diameter modelling' are publicly available and provide the R code used to derive the generalised stand descriptions from the Swiss NFI data.52 years ago
- Outlines of 18'737 avalanches mapped from SPOT6 satellite data over the Swiss Alps on 24 January 2018. The outlines have different attributes described in the data example key (ExampleKey_AvalMapping.pdf) The generation of the data is described in: Bühler, Y., E. D. Hafner, B. Zweifel, M. Zesiger, and H. Heisig (2019), Where are the avalanches? Rapid SPOT6 satellite data acquisition to map an extreme avalanche period over the Swiss Alps, The Cryosphere, 13(12), 3225-3238, doi:10.5194/tc-13-3225-2019. Abstract. Accurate and timely information on avalanche occurrence are key for avalanche warning, crisis management and avalanche documentation. Today such information is mainly available at isolated locations provided by observers in the field. The achieved reliability considering accuracy, completeness and reliability of the reported avalanche events is limited. In this study we present the spatial continuous mapping of a large avalanche period in January 2018 covering the majority of the Swiss Alps (12’500 km2). We tested different satellite sensors available for rapid mapping during a first avalanche period. Based on these experiences, we tasked SPOT6/7 data for data acquisition to cover the second, much larger avalanche period. We manually mapped the outlines of 18’737 individual avalanche events, applying image enhancement techniques to analyze regions in cast shadow as well as brightly illuminated ones. The resulting dataset of mapped avalanche outlines, having a unique completeness and reliability, is evaluated to produce maps of avalanche occurrence and avalanche size. We validated the mapping of the avalanche outlines using photographs acquired from helicopters just after the avalanche period. This study demonstrates the applicability of optical, very high spatial resolution satellite data to map an exceptional avalanche period with very high completeness, accuracy and reliability over a large region. The generated avalanche data is of great value to validate avalanche bulletins, complete existing avalanche databases and for research applications by enabling meaningful statistics on important avalanche parameters. Koordinate System: CH1903+ LV95 LN0212 years ago
- Litterfall is a key parameter in the biogeochemical cycle of forest ecosystems, linking the tree part to the soil compartment. Litterfall has been collected on 15 LWF plots using 10 traps that are emptied every 4 to 8 weeks since 1996 or later. Both the biomass of the litter and its chemical content (including heavy metals) are measured, in order to quantify the annual return of nutrients and organic matter to the soil. Furthermore, the analysis of the temporal pattern of litterfall production gives insight into possible effects of anthropogenic and natural factors (e.g. severe drought) on the ecosystem and the vitality of the forest stand, provides information on the phenological development of the stand, and, in particular, allows mast years to be identified. At 7 broadleaved sites, litterfall was also used to estimate the leaf area index (LAI) of the forest stand. ### Purpose: ### To quantify the annual return of nutrients and organic matter to the soil. ### Manual Citation: ### * Thimonier, A., Brang, P., Ottiger, A., 1997. Kapitel C5. Streufall, in: Brang, P. (Ed.), Aufnahmeanleitungen aller Forschungsprojekte auf Flächen der Langfristigen Waldökosystem-Forschung (LWF). Eidg. Forschungsanstalt WSL, Birmensdorf, pp. 1-18. * Ukonmaanaho L., Pitman R, Bastrup-Birk A, Breda N, Rautio P, 2016: Part XIII: Sampling and Analysis of Litterfall. In: UNECE ICP Forests Programme Co-ordinating Centre (ed.): Manual on methods and criteria for harmonized sampling, assessment, monitoring and analysis of the effects of air pollution on forests. Thünen Institute for Forests Ecosystems, Eberswalde, Germany, 14 p. + Annex [http://icp-forests.net/page/icp-forests-manual](http://icp-forests.net/page/icp-forests-manual) ### Paper Citation: ### * Thimonier A, Sedivy I, Schleppi P (2010) Estimating leaf area index in different types of mature forest stands in Switzerland: a comparison of methods. European Journal of Forest Research, 129 (4): 543-562. [doi: 10.1007/s10342-009-0353-8](http://doi.org/10.1007/s10342-009-0353-8 )12 years ago
- Stable water isotopes (δ18O) obtained from snow and ice samples of polar regions are used to reconstruct past climate variability, but heat and mass transport processes can affect the isotopic composition. Here we present an experimental study on the effect on the snow isotopic composition by airflow through a snow pack in controlled laboratory conditions. The influence of isothermal and controlled temperature gradient conditions on the δ18O content in the snow and interstitial water vapor is elucidated. The observed disequilibrium between snow and vapor isotopes led to exchange of isotopes between snow and vapor under non-equilibrium processes, significantly changing the δ18O content of the snow. The type of metamorphism of the snow had a significant influence on this process. Ebner, P. P., Steen-Larsen, H. C., Stenni, B., Schneebeli, M., and Steinfeld, A.: Experimental observation of transient δ18O interaction between snow and advective airflow under various temperature gradient conditions, The Cryosphere Discuss., https://doi.org/10.5194/tc-2017-16, accepted, 2017.22 years ago
- Radiosondes (Windsond, Sparv Embedded AB) were started in Davos Wolfgang (LON: 9.853594, LAT: 46.835577) to report height profiles of pressure, relative humidity and temperature at specific days. In addition to regular launches of radiosondes, sondes were attached to [HoloBalloon](https://www.envidat.ch/group/clouds-in-situ-raclets) to report the ambient conditions of the in-situ measurements. Further profiles of meteorological measures were recorded at [HoloGondel](https://www.envidat.ch/group/clouds-in-situ-raclets) which was installed at the gondola moving between Gotschnaboden and Gotschnagrat at 2285 m a.s.l.22 years ago
- Attention: this data is not updated after 2022 anymore. This data collection contains information concerning all accidents by snow avalanches causing at least one fatality in Switzerland. The data set commences on 01/10/1995. After the completion of a hydrological year, the new data is added. The following information is provided: * avalanche identifier * date of the accident * accuracy of the date in range of days before and after * canton * name of the locality * start zone of the avalanche * coordinates (Swiss coordinate system, approximately in middle of start zone) * accuracy of the coordinates in meters * elevation (in meteres above sea level, app. in middle of start zone) * slope aspect (main orientation of start zone) * slope inclination (in degree, steepest point within start zone) * number of dead persons * number of caught persons * number of fully buried persons * forecasted avalanche danger level * activity/location of the accident party at the time of the incident12 years ago
- In the canton of Aargau, hundreds of new ponds have been constructed since the 1990s to benefit declining amphibian populations. This dataset consists of monitoring data for all 12 pond-breeding amphibian species in the canton of Aargau from 1999 to 2019 in 856 ponds, and environmental variables that describe the ponds and the landscape surrounding the ponds. Species observation data is detection/non-detection data from repeat visits during survey years, during which all potentially suitable ponds in an area were surveyed. Environmental variables describing the ponds are whether the pond has been newly constructed since 1991 or not, pond age (if constructed), elevation a.s.l., the water surface area, and whether the water table fluctuates or not. Environmental variables describing the surroundings of the ponds are the percent area of forest within a circular buffer of radius 100m around the pond, the area of large (width ≥6m) roads within a circular buffer of radius 1km around the pond, as well as structural and potential population connectivity, quantified by three different metrics each. The canton of Aargau is the owner of the monitoring data; the original datafile is only disclosed upon request and in consultation with the canton of Aargau. The edited dataset contains cleaned observation data for the 12 amphibian species, as well as compiled and edited covariate data and code to fit dynamic occupancy models.122 years ago
- Although species range may be obtained using expert maps or modeling methods, expert data is often species-limited and statistical models need more technical expertise as well as many species observations. When unavailable, such information may be extracted from the Global Biodiversity Information facility (GBIF), the largest public data repository inventorying georeferenced species observations worldwide. However, retrieving GBIF records at large scale may be tedious if users are unaware of specific tools and functions that need to be employed. Here we present *gbif.range*, an R library that contains automated methods to generate species range maps from scratch using in-house ecoregions shapefiles and an easy-to-use GBIF download wrapper. Finally, this library also offers a set of additional very useful parameters and functions for large GBIF datasets (generate doi, extract GBIF taxonomy, records filtering...). [gbif.range R project](https://github.com/8Ginette8/gbif.range)42 years ago
- High quality meteorological data are needed for long-term forest ecosystem research, particularly in the light of global change. The long-term data series published here comprises almost 20 years of measurements for two meteorological stations in Lausanne in Switzerland where one station is located within a natural mixed forest stand (LAB) with European beech (_Fagus sylvatica_; 160-170 yrs), European silver fir (_Abies alba_; 160-170 yrs) and Norway spruce (_Picea abies_; 160-170 yrs) as dominant tree species. A second station is situated in the very vicinity outside of the forest (field station, LAF). The meteorological time series are presented in hourly time resolution of air temperature, relative humidity, precipitation, photosynthetically active radiation (PAR) and wind speed. Lausanne is part of the Long-term Forest Ecosystem Research Programme (LWF) established and maintained by the Swiss Federal Research Institute WSL.72 years ago
- Sum of stem cross-section areas at a height of 1.3 m (dbh measurement height) of all living and dead trees and shrubs starting at 12 cm dbh recorded according to the NFI1 method. In NFI1 only those dead trees were recorded whose wood could still be exploited. __Citation:__ > _Abegg, M.; Brändli, U.-B.; Cioldi, F.; Fischer, C.; Herold-Bonardi, A.; Huber M.; Keller, M.; Meile, R.; Rösler, E.; Speich, S.; Traub, B.; Vidondo, B. (2014). Fourth national forest inventory - result tables and maps on the Internet for the NFI 2009-2013 (NFI4b). [Published online 06.11.2014] Available from World Wide Web http://www.lfi.ch/resultate/ Birmensdorf, Swiss Federal Research Institute WSL. [doi:10.21258/1057112](https://doi.org/10.21258/1057112)_12 years ago
- The dataset contains several snow models in the Standard Tesselated Geometry File Format (stl) for 3D visualization, printing and additive manufacturing. Different snow types are available (new snow, rounded snow, depth hoar, buried surface hoar, graupel).22 years ago
- The data base contains timeseries of stable water isotopes in precipitation and streamflow at Plynlimon, Wales, UK. One data set contains weekly stable water isotope data from the Lower Hafren and Tanllwyth catchments, and the other data set contains 7-hourly stable water isotope data from Upper Hafren. Both data sets also include chloride concentrations in precipitation and streamflow.32 years ago
-  LWF Plot Isone - Community: Isone / canton TI - Date of installation: 5 September 1995 - Size of the plot: 2 ha - Altitude (m): 1181-1259 - Mean slope: 58% - Geology (in German): Untergrund: Südalpin, präpermisches Grundgebirge, Ceneri Zone; schiefriger Biotitplagioklasgneis - Oberfläche: Quartär; Moräne, Hängeschutt-. - Provisional soil type (WSL) : Humic Cambisol - Woodland association after EK72: 4: Luzulo niveae-Fagetum dryopteridetosum - Main tree species: Fagus sylvatica - Management system: former coppice - Silvicultural system: unmanaged - Top-height diameter (quadratic average diameter of the 100 thickest trees per ha): 37.4 cm - Number of trees BHD >= 12 cm (2011): 1254 - Maximum tree age: Fagus sylvatica uneven-aged - 70-85-100 yr More Information: https://www.wsl.ch/en/forest/forest-development-and-monitoring/long-term-forest-ecosystem-research-lwf/sites/isone.html22 years ago
- The present dataset is part of the published scientific paper Zhao C, Weng Q, Hersperger A M. Characterizing the 3-D urban morphology transformation to understand urban-form dynamics: a case study of Austin, Texas, USA. Landscape and urban planning, 2020, 203:103881. The overall objective of this paper is to understand urban form dynamics in the Austin metropolitan area for the periods 2006–2011 and 2011–2016. The study also aims to understand to what extent the changes in the built environment (in terms of ‘efficient growth’ versus ‘inefficient growth’) from the 1990s to 2016 in the Austin metropolitan area corresponded with ‘compact and efficient growth’ planning policy documents. The UMT distribution can be found in the paper. The area of transitioning UMT was provided in Table 2 and Table 3 can be found in the Appendix of the paper. A protocol was developed to perform the content analysis of the strategic plans and gather the data. The detailed list of protocol items can be found in Appendix B of the paper. This study demonstrates the advantage of applying Lidar data to characterize 3-D urban morphology type (UMT) transition and understand its dynamics, which helps develop a comprehensive understanding of the urbanization process and provides a tool for planning intentions and policies evaluation on urban development over time. The UMT maps can be found in Appendix A of the paper. The Lidar point datasets and the 30 × 30 m National Land Cover Database (NLCD) are the two main data sources of UMT mapping. Lidar datasets were gathered from different projects that had been conducted and collected by state agencies and other organizations between 2007 and 2017. Table A1 in the appendix in the paper shows the accuracies and acquisition parameters of the Lidar projects from 2007 to 2017. Land use/cover dynamics in Austin metropolitan area dataset provides Land use/cover patterns in the years 1992, 2001, 2004, 2006, 2008, 2011, 2013, 2016 with a spatial resolution of 30 meters. Since NLCD 1992 used a different classification system for the urban land classes, we first reclassified the NLCD 1992 using a customized Arcpy package.12 years ago
- This dataset provides distribution data of lichens in Switzerland of the National Data and Information Centre, called Swiss Lichens. SwissLichens is a partner of InfoSpecies, the network of Swiss data and information centres for fauna, flora and fungi. One of its main objectives is to document the spatial and temporal distribution of species in Switzerland. The SwissLichens database currently contains more than 120’000 georeferenced lichen observations, distributed throughout Swizerland. The oldest observations date back to 1790. A large portion of the records dtae from the last two decades of the last century to the present day. The database is continuously updated with new findings. The data have been validated and originate from national inventories, from research projects, from floristic observations by volunteers as well as from private and public herbaria and from the literature. Each record consists of the species name, information of the location (Swiss Coordinates, precision of the coordinates, elevation above sea level, municipality and canton), the date of observation, the ecotype (epiphytic, terricol, lignicol, saxicol), as well as information on the conservation status of the species (red list status, conservation priority status, status in the Nature and Cultural Heritage Act). Information on the ecology (habitat, substrate) is partially available. They are free of charge for research projects and can be requested from InfoSpecies using a form. Licence under www.infospecies.ch. Data is free of charge for research projects and available on request.12 years ago
- This dataset contains the data used in the publication by Techel et al., 2018 _Spatial consistency and bias in avalanche forecasts - a case study in the European Alps_ (Nat Haz Earth Syst Sci). For details on the data please refer to this publication. The dataset contains the following: - shape files for the warning regions in the Alps - highest forecast danger level for each warning region and day22 years ago
- In this study, the Austin metropolitan area, Texas, U.S., one of the fastest urban transformations and transformations regions, is selected to test the hypothesis that spatial planning and policies are important factors of urban transformations. Despite ample previous work in understanding the interactions between human and urban form transformation at specific areas, the actual interventions and outcomes of planning and policies (e.g., ‘smart growth’) on urban forms have been poorly measured. In this study, the potential influencing factors of urban transformations of Austin over 25 years were selected and collected.12 years ago
- This dataset contains the results of a five-day field excursion which the extent to which eDNA sampling can capture the diversity of a region with highly heterogeneous habitat patches across a wide elevation gradient through multiple hydrological catchments of the Swiss Alps. Using peristaltic pumps, we filtered 60 L of water at five sites per catchment for a total volume of 1 800 L. Using an eDNA metabarcoding approach focusing on vertebrates and plants, we detected 86 vertebrate taxa spanning 41 families and 263 plant taxa spanning 79 families across ten catchments. This dataset includes two sets of data. The first (Genomic data) includes all the necessary data for the bioinformatic pipeline, whereas the second (Analysis Figures) contains tidied data and scripts for the reproduction of all figures/analyses in the article describing this study.32 years ago
- # Abstract Snow and hydrological modeling in alpine environments remains a challenge because of the complexity of the processes complexity affecting the mass and energy balance. This study examines the influence of snowmelt on the hydrological response of a high-alpine catchment of 43.2 km2 in the Swiss Alps during the water year 2014-2015. Based on recent advances in Alpine3D, we examine how modeled snow distributions, and modeled liquid water transport within the snowpack influence runoff dynamics. By combining these results with multi-scale field data (snow lysimeter data, distributed snow depths and streamflow), we demonstrate the added value of a more realistic representation of snow distribution at the onset of melt season. At the site scale, snowpack runoff is well simulated when the snowpack mass balance errors are corrected (R2 = 0.95 vs. R2 = 0.61). At the sub-basin scale, a more heterogeneous snowpack leads to a more rapid runoff pulse originated in the shallower areas while an extended melting period (by more than a month) is caused by slower snowmelt from deeper areas. This result is a marked improvement over results obtained using a less heterogeneous snow distribution (i.e., traditional precipitation interpolation method). Catchment hydrological response is also improved by the more realistic representation of snowpack heterogeneity (Nash coefficient of 0.85 vs. 0.74), even though the calibration process smoothens out the differences. The added value of a more complex liquid water transport scheme is obvious at the site scale but decreases at the sub-basin and basin scales. Our results highlight not only the importance but also the difficulty of getting a realistic snowpack distribution even in a well-instrumented area and present a model validation from multi-scale experimental datasets.12 years ago
- A laser optical disdrometer (Parsivel² , OTT Hydromet) was used to measure hydrometeors by extinction when passing a laser beam. The instrument can classify eight different kinds of precipitation, including rain, hail, snow, drizzle, and hybrid forms. The dataset contains information on precipitation amount and type for the period of February 7 to March 29 2019 in Laret.12 years ago
- Title: Closer to causality: How effective is spatial planning in governing built-up land expansion in Fujian Province, China? Research objective: The Major Function Oriented Zone (MFOZ), the first strategic spatial plan in China, is developed to achieve a coordinated regional development, through spatial regulation and zoning of development. The MFOZ he MFOZ divided land into four major function-oriented zones: The development-optimized zone, the development-prioritised zone, the development-restricted zone, and the development-prohibited zone. We used propensity score marching to evaluate the effect of the MFOZ on built-up land expansion in Fujian Province over three time intervals (2013–2015, 2013–2018 and 2013–2020). Data: Data.xlsx contains the variables of 954 towns in Fujian Province. Town_ID is the town unique ID; County_ID is the county unique ID; City_ID is the city unique ID; MFOZ is the the development-prioritised zone and the development-restricted zone (The development-optimized zone and the development-prohibited zone are excluded); Builtup_13_15 is the built-up land expansion from 2013 to 2015; Builtup_13_18 is the built-up land expansion from 2013 to 2018; Builtup_13_20 is the built-up land expansion from 2013 to 2020; Dis2water is the Euclidean distance from the town to the nearest waterbody; Slope is the the average slope within the town; GDP is the average GDP in 2010 within the town; Pop is the average population in 2010 within the town; Road is the average population in 2010 within the town; Dis2city is the Euclidean distance from the town to the nearest prefectural city centre; Nei_Arable, Nei_Forest, and Nei_Built.up are the area of arable land, forest land, and built-up land neighbouring town i in 2010. Method: we used the propensity score matching to compare the changes in the amount of built-up land in the towns of the development-prioritised zone with the matched towns of the development-restricted zone. Additionally, we used three evaluation intervals (2013–2015, 2013–2018 and 2013–2020) to evaluate temporal variation in the causal effect of the MFOZ on built-up land expansion.12 years ago
- A weather station (Lufft WS600) measured meteorological parameters at Klosters (LON: 9.880413, LAT: 46.869019). Detailed information on the specifications can be found [here](https://www.lufft.com/products/compact-weather-sensors-293/ws600-umb-smart-weather-sensor-1832/productAction/outputAsPdf/).12 years ago
- This data set includes information on all observed and simulated snow profiles that were used to train and validate the random forest model described in Mayer et al. (2022). The RF model was trained to assess snow instability from simulated snow stratigraphy. The data set contains observed snow profiles from the region of Davos (DAV subset, 512 profiles) and from all over Switzerland (SWISS subset, 230 profiles). For each observed snow profile, there is a corresponding simulated profile which was obtained using meteorological input data for the numerical snow cover model SNOWPACK. The information on the observed snow profile contains a Rutschblock test result including the depth of the failure interface. As part of the study described in Mayer et al. (2022), each observed snow profile was manually compared to its simulated counterpart and the simulated layer corresponding to the Rutschblock failure layer was identified. The data are provided in the following form: one file each per observed and simulated snow profile (2x512 files DAV, 2x230 files SWISS), two files (1 file DAV, 1 file SWISS) containing the observed information on snow instability, the allocation between observed and simulated failure layer, and all features extracted from the simulated weak layers that were used to develop the RF model.52 years ago
- A Young 81000 sonic anemomenter was deployed at Gotschnagrat (LON: 46.859 LAT: 9.849) to record three components of the wind velocity (u, v, w in [m s‾ ¹]) and air temperature (Ts in [°C]). The anemomenter was mounted in direction North at a height of 1.5 m above snow surface at the beginning. The time within each data set is given in UTC+1. Instrument specifications can be found [here](http://www.youngusa.com/Manuals/81000-90(I).pdf) .52 years ago
- This dataset provides distribution data of fungi in Switzerland of the National Data and Information Centre, called [SwissFungi](https://swissfungi.wsl.ch/en/index.html). SwissFungi is a partner of [InfoSpecies](https://www.infospecies.ch/de/), the network of Swiss data and information centres for [fauna](http://www.cscf.ch/cscf/de/home.html), [flora](https://www.infoflora.ch/en/) and [fungi](https://swissfungi.wsl.ch/en/index.html). One of its main objectives is to document the spatial and temporal distribution of species in Switzerland. The SwissFungi database currently contains more than 670'000 geo-referenced fungi observations, distributed throughout Switzerland. The oldest observations date back to 1770. A large portion of the records are from the last two decades of the last century to the present day. The database is continuously updated with new fungi records. The data have been validated and originate from national inventories, from research projects, from floristic observations by volunteers as well as from private and public herbaria and from the literature. The data from the distribution atlas of fungi in Switzerland are available for research and practice (nature conservation projects, environmental impact assessments etc.) and can be obtained via an [application form](https://www.infospecies.ch/de/assets/content/documents/Formular_Datenanfrage20190625.pdf). Please note the tariffs for data requests and submit your request directly to the [InfoSpecies](https://www.infospecies.ch/de/) office. Applications are usually answered within two working weeks. Details on the use of data are regulated in the current guidelines of the national data centers. Please note that the data center SwissFungi is not able to verify all incoming fungal records completely for a correct identification or coordinate errors and therefore cannot guarantee the correctness of the information. License under [InfoSpecies](https://www.infospecies.ch/de/). Data is free of charge for research projects and available on request.12 years ago
- The dataset "RoRCC" consists of simulation-based results on climate change impacts on Alpine RoR power production; it is based on 21 Swiss RoR power plants, with a total production of 5.9 TWh a-1. The dataset contains the following information: 1) metadata on the RoR power plants under consideration, 2) annual and seasonal production potential scenarios under into three emission scenarios (RCP2.6, RCP4.5, RCP8.5) and three future periods (T1: 2020–2049, T2: 2045–2074, T3: 2070–2099), 3) annual and seasonal streamflow scenarios, 4) annual and seasonal production loss due to environmental flow requirements, 5) annual and seasonal the technical increase potential (via design discharge optimisation) and 6) annual and seasonal changes in the hydrological cycle.12 years ago
- This is the source code of the Inishell-2.0.4 flexible Graphical User Interface. It is configured through an XML file for applications that themselves need to be configured via ini-files. It allows to set constraints regarding the sections, keys and values that may be present in the ini-files that are produced by the end user. It is released under the GPL-v3 or later license. Precompiled binaries are available at https://models.slf.ch/p/inishell-ng/downloads/ while the development takes place at https://code.wsl.ch/snow-models/inishell (gitlab forge).12 years ago
- In order to use the QGIS plugin ‘Seilaplan’ for digital cable line planning, a digital terrain model (DTM) is required. As an alternative to using the ‘Swiss Geo Downloader’ plugin, the DTM can be obtained directly from Swisstopo. In this tutorial we explain step by step how to download the necessary DTM from the Swisstopo Website, and how to use it in QGIS for the digital planning of a cable line using the plugin ‘Seilaplan’. Please note that the tutorial language is German! Link to the elevation model on the swisstopo website: https://www.swisstopo.admin.ch/de/geodata/height/alti3d.html#technische_details Link to the rope map website: https://seilaplan.wsl.ch ******************** Für die Verwendung des QGIS Plugins Seilaplan zur digitalen Seillinienplanung ist ein digitales Höhenmodell (DHM) nötig. Als Alternative zum Swiss Geo Downloader erklären wir in diesem Tutorial Schritt für Schritt, wie man das nötige Höhenmodell von der Swisstopo Webseite herunterladen und in QGIS zur Seillinienplanung verwenden kann. Link zum Höhenmodell auf der swisstopo Webseite: https://www.swisstopo.admin.ch/de/geodata/height/alti3d.html#technische_details Link zur Seilaplan-Website: https://seilaplan.wsl.ch22 years ago
- __Cloud Condensation Nuclei (CCN) data:__ A Droplet Measurement Technologies (DMT) single-column continuous-flow streamwise thermal gradient chamber (CFSTGC; Roberts and Nenes, 2005) was deployed at the measurement site Weissfluhjoch (2700 m a.s.l., LON: 9.806475, LAT: 46.832964) to record the in-situ CCN number concentrations between February 24 and March 8 2019 for different supersaturations (SS). To account for the difference between the ambient (~735 mbar) and the calibration pressure (~800 mbar), the SS reported by the instrument is adjusted by a factor of 0.92. The CFSTGC was cycled between 6 discrete SS values ranging from 0.09% to 0.74%, producing a full CCN spectrum every hour. The raw CCN measurements are filtered to discount periods of transient operation and whenever the room temperature housing the instrument changed sufficiently to induce a reset in column temperature. Additional information can be found in Section 2.1.2 [here](https://acp.copernicus.org/preprints/acp-2020-1036/). __Hygroscopicity data:__ The CCN number concentration measurements were directly related to the size distribution and total aerosol concentration data measured by the Scanning Mobility Particle Size Spectrometer (SMPS) instrument at the same station (https://www.envidat.ch/dataset/aerosol-data-weissfluhjoch) to infer the particles hygroscopicity parameter (kappa). For each SMPS scan, the particles critical dry diameter (Dcr) is estimated by integrating backward the SMPS size distribution, until the aerosol number matches the CCN concentration observed for the same time period as the SMPS scan. Assuming the particle chemical composition is internally mixed, the kappa is determined from Dcr and SS, applying Köhler theory. Additional information can be found in Section 2.2 [here](https://acp.copernicus.org/preprints/acp-2020-1036/). __Predicted cloud droplet numbers:__ Droplet calculations are carried out with the physically based aerosol activation parameterization of Morales and Nenes (2014), employing the “characteristic velocity” approach of Morales and Nenes (2010). Aerosol size distribution observations required to predict the cloud droplet numbers and maximum in-cloud supersaturation are obtained from the SMPS instrument deployed at Weissfluhjoch. The required vertical velocity measurements are derived from the wind Doppler Lidar (https://www.envidat.ch/dataset/lidar-wind-profiler-data) deployed at Davos Wolfgang and are extracted for the altitude of interest, being 1100 m above ground level for Weissfluhjoch. Additional information can be found in Section 2.3 [here](https://acp.copernicus.org/preprints/acp-2020-1036/).32 years ago
- The WFJ_RHOSSA dataset contains multi-instrument, multi-resolution snow stratigraphy measurements for the seasonal evolution of the snowpack from the Weissfluhjoch research site, Davos, Switzerland. The measurements were initiated during the RHOSSA field campaign conducted in the winter season 2015–2016 with a focus on density (RHO) and specific surface area (SSA) measurements. The Instruments and methods used in the campaign at different spatial and temporal resolution are: SnowMicroPen, Density Cutter, IceCube, Traditional profiles, Stability tests and X-ray tomography. The measurements are complemented by simulation data from the model SNOWPACK.22 years ago
- ## Topic of Survey The data at hand on energy cooperatives in Switzerland were collected in 2016 as part of the project "Collective financing of renewable energy projects in Switzerland and Germany" of the National Research Programme 71 "Managing Energy Consumption". The cooperatives were surveyed on their organizational structure, their activities in electricity and heat generation, their finances, the political context and their assessments of the future. ## Survey Method The survey was targeted at all energy cooperatives in Switzerland (this is the basic population). The Swiss Commercial Register was searched for cooperatives and specific keywords in order to determine this basic population and collect addresses. This search in May 2016 resulted in a total of 304 energy cooperatives, to which a questionnaire was sent in July 2016. A pre-test with 8 persons had been carried out before the questionnaire was sent out. The questionnaire was provided in German and French. It was sent by mail and an attached letter referred to a link for the digital version if preferred. The online version was designed with the software "Sawtooth". After three weeks, a first, and after six weeks a second reminder letter was sent to those cooperatives that had not yet completed the questionnaire. The returned hardcopy questionnaires were manually entered into the database and then combined with the electronic data from the online survey. In the course of the survey, the total population was reduced from 304 to 289: in 4 cases the survey was not deliverable, 4 cooperatives had dissolved, 6 were not actually energy cooperatives, 1 case had recently changed its legal form. With a response rate of 47%, the final data set comprises 136 responses (from 77 digital and 59 hardcopy questionnaires). However, not all 136 of the returned questionnaires were filled out completely. We checked for answers that seemed contradictory or incomprehensible. If an error could be clearly identified and the correct answer derived, the answer was adjusted, otherwise the answer was replaced by "missing data". # Anonymization Participating cooperatives have been assured that their information will be kept confidential and will only be made public anonymously. For this reason, the data have been anonymized in in order to prevent any identification of individual cooperatives. # How to Use the Data * The data are available in CSV and SPSS (sav.) format. * A codebook and a modified version of the used questionnaire are provided to illustrate the data and variable structure. In the questionnaire, the variable names are assigned to the corresponding questions. In the codebook, further information on these variables (valid n, answer categories) can be found. This information (of the codebook) is already integrated in the SPSS file. # Current Embargo on Data These data are currently under embargo and will only be released when the project is completed (not before 2020). #Additional Information * The used questionnaire is provided in German and French. * Descriptive results of the survey were published in a WSL report: https://www.dora.lib4ri.ch/wsl/islandora/object/wsl:1894342 years ago
-  LWF Plot Othmarsingen - Community: Othmarsingen / canton AG - Date of installation: 9 September 1994 - Size of the plot: 1 ha - Altitude (m): 467-500 - Mean slope: 27% - Soil types (WSL): Stagnic Luvisols, Haplic Luvisols - Woodland association after EK72: 7: Galio odorati-Fagetum typicum - Main tree species: Fagus sylvatica - Management system: former coppices w. standards - Silvicultural system: group selection - Top-height diameter (quadratic average diameter of the 100 thickest trees per ha): 62.8 cm - Number of trees BHD >= 12 cm (2011): 167 - Maximum tree age: Fagus sylvatica 120-140 yr - Tilia sp. 120-140 yr More Information: https://www.wsl.ch/en/forest/forest-development-and-monitoring/long-term-forest-ecosystem-research-lwf/sites/othmarsingen.html22 years ago
- This dataset contains the values of several chemical elements (Mg, Al, Si, S, K, Ca, Ti, Cr, Mn, Fe, Co, Ni, Cu, Zn, As, Sr, Tl, Pb, Bi) measured in the latewood of tree rings of Mongolian oak from Harbin, China, at a 5-year resolution. Due to the lack of a suitable reference material for wood, absolute concentration was not calculated, and the ratio between the chemical element and 13C was taken as proxy for the element signal. In Harbin, one of the largest cities and most important industrial centers in northeastern China, air quality monitoring systems were built only by the end of 2015 to meet the national requirements. Thus, dendrochemical analyses could be used as a tool to complement for the lack of air quality data over longer periods of time, allowing for the reconstruction of the temporal trend of trace metals. Our main scopes were to: (a) assess the chemical composition of Quercus mongolica Fisch. ex Ledeb. tree rings from Harbin using a recently developed system of laser ablation-inductively coupled plasma-mass spectrometry (LA-ICP-MS), (b) identify the main chemical elements which derived from air pollution and may be used as indicators over the period 1965–2020 in Harbin, while excluding those that were controlled by physiological processes in the tree, and (c) reconstruct the history of pollution in Harbin by comparing the tree-ring chemical composition of recent decades with that of previous decades, in trees growing in the highly polluted city of Harbin and in trees growing in a control site 90 km away from major pollution sources. Briefly, the temporal trend of some elements was influenced by physiological factors, by environmental factors such as pollution, or influenced by both. Mg, K, Zn, Cu, Ni, Pb, As, Sr and Tl showed changes in pollution levels over time.12 years ago
- High quality meteorological data are needed for long-term forest ecosystem research, particularly in the light of global change. The long-term data series published here comprises almost 20 years of measurements for two meteorological stations in Celerina in Switzerland where one station is located within a natural coniferous forest stand (CLB) with Swiss pine (_Pinus cembra_; 210-250 yrs) as dominant tree species. A second station is situated in the very vicinity outside of the forest (field station, CLF). The meteorological time series are presented in hourly time resolution of air temperature, relative humidity, precipitation, photosynthetically active radiation (PAR) and wind speed. Celerina is part of the Long-term Forest Ecosystem Research Programme (LWF) established and maintained by the Swiss Federal Research Institute WSL.72 years ago
- Surface topography maps (spatial extent: 400 m x 400 m) obtained at approximately 300 m from the top of the Hammarryggen Ice Rise in Dronning Maud Land, East Antarctica, using a Riegl VZ-6000 Terrestrial Laser Scanner (TLS). Scans were obtained on 5 days in the 2018-2019 Austral summer: on December 21 and 27, and January 2, 4 and 11. By using reflectors installed on bamboo poles, scans were registered with respect to the reflectors, such that the difference between two successive scans reveals the spatial patterns of erosion and deposition of snow. On each scan day, we used multiple scan positions to create one combined point cloud. After applying an octree filter on the point cloud, a 3D surface was obtained. For each day, the dataset contains a 1 mm and a 10 cm octree filter resolution file, only including points in a 400 m x 400 m area centered around the scan positions. Notes: * All files in the dataset are in the same coordinate system. However, this coordinate system is arbitrary (i.e., not related to any global coordinate system). * From the installed reflectors, 4 reflectors could be used over the full period. The scan accuracy is generally higher within the area enclosed by the reflectors. * The scans from January 2 were found to have exhibited small tilt during the scan and are of lesser accuracy. * By walking along fixed corridors, disturbance of the snow was limited.112 years ago
- Tree-ring data and tree location from 470 European beech trees (Fagus sylvatica L.) located in the northern part of Switzerland. 278 trees showed drought-induced premature leaf discoloration and shedding in summer 2018 and 192 showed normal leaf fall. The trees were selected from the "1000-Beech-Project" published by Frei et al. 2022 and the data was analyzed in Neycken et al 2023 (in preparation). The corresponding crown data are archived in the EnviDat data portal https://doi.org/10.16904/envidat.422 (Frei et al. 2023). All other data generated during and/or analyzed during the current study are available from the corresponding author upon reasonable request. Publications related to original data set and crown data: Wohlgemuth, T., Kistler, M., Aymon, C., Hagedorn, F., Gessler, A., Gossner, M.M., Queloz, V., Vögtli, I., Wasem, U., Vitasse, Y., Rigling, A., 2020. Früher Laubfall der Buche während der Sommertrockenheit 2018: Resistenz oder Schwächesymptom? Schweizerische Zeitschrift fur Forstwesen 171, 257–269. https://doi.org/10.3188/szf.2020.0257 Frei, E.R., Gossner, M.M., Vitasse, Y., Queloz, V., Dubach, V., Gessler, A., Ginzler, C., Hagedorn, F., Meusburger, K., Moor, M., Samblás Vives, E., Rigling, A., Uitentuis, I., von Arx, G., Wohlgemuth, T., 2022. European beech dieback after premature leaf senescence during the 2018 drought in northern Switzerland. Plant Biol J 24, 1132–1145. https://doi.org/10.1111/plb.13467 Publication related to tree-ring data and growth analysis: Neycken et al 2023 (in preparation)42 years ago
- Hydrometerological and ecohydrological time series from Sagehen Creek and Independence Creek, Sierra Nevada, USA, illustrating hydrological responses to daily cycles in snowmelt and evapotranspiration forcing. Data include 30-minute time series of - weather variables, - sap flow fluxes, - groundwater levels (in two riparian transects of shallow groundwater wells), - and stream stages (at 12 sites spanning a 500-meter elevation gradient), and daily time series of - temperature, precipitation, and snow water equivalent at three nearby snow telemetry stations - diel cycle index values for groundwater levels and stream stages, - and MODIS normalized difference snow index (NDSI) and enhanced vegetation index (EVI2) values averaged over selected subcatchments. Google Earth Engine scripts for extracting the MODIS data are also provided.62 years ago
-  LWF Plot Novaggio - Community: Novaggio / canton TI - Date of installation: 8.3.95 - Size of the plot: 1.5 ha - Altitude (m): 902-997 - Mean slope: 68% - Geology (in German): Untergrund: Südalpin, präpermisches Grundgebirge; Orthogneis, schiefriger Biotitplagioklasgneis - Oberfläche: Quartär; karbonatfreie würmeiszeitliche Moräne - Provisional soil type (WSL): Kryptopodzole - Woodland association after EK72: 42: Phyteumo betonicifoliae-Quercetum castanosum - Main tree species: Quercus cerris - Management system: former coppice - Silvicultural system: unmanaged - Top-height diameter (quadratic average diameter of the 100 thickest trees per ha): 27.0 cm - Number of trees BHD >= 12 cm (2011): 1130 - Maximum tree age: Castanea sativa 90 yr- Betula pendula 70 yr - Quercus cerris 70 yr More Information: https://www.wsl.ch/en/forest/forest-development-and-monitoring/long-term-forest-ecosystem-research-lwf/sites/novaggio.html22 years ago
- This dataset comprises a large array of ecological data for the European Alps: (1) Current soil and climate predictors at various resolutions. (2) GBIF observations of the European Alps Flora (~4,000 species). (3) Species habitat suitability maps (1,109 species; based on species observations filtered at 40x40-km) at various resolutions used in the study to generate (4); except 'expert'... (4) Expert, Taxonomic, phylogenetic and functional diversity of the study region at various resolutions (from 100-m to 40-km --> 100-m aggregated & mean to km + non-aggregated/predicted) for CLIM, SOIL and CLIM-SOIL models. (5) Ecological and altitudinal preferences of the European Alps Flora. (6) Data outputs of the related published article. (7) All scripts used for analyses. (8) Additional files used for analyses. (9) Improved set of species habitat suitability maps (~2,600 species; based on species observations filtered at 1x1-km) and related taxonomic diversity at 100-m resolution (aggregated to km + non-aggregated/predicted) for CLIM, SOIL and CLIM-SOIL models ---> not incorporated in the study.12 years ago
- This dataset includes species lists of bryophytes and macrolichens (presence/absence) sampled on the forest floor and on trees in disturbed and undisturbed plots along elevation gradients in the laurel forests of Madeira island. It also contains species specific information (bryophytes: red list status, endemic status, taxonomic group, life strategy; macrolichens: photobiont type, growth form) as well as plot information (Plot_ID, sampling date, coordinates, elevation a.s.l. (m), disturbance type, sampled host tree species). The dataset was used for the paper Boch S, Martins A, Ruas S, Fontinha S, Carvalho P, Reis F, Bergamini A, Sim-Sim M (2019) Bryophyte and macrolichen diversity show contrasting elevation relationships and are negatively affected by disturbances in laurel forests of Madeira island. Journal of Vegetation Science 30: 1122–1133. The excel file contains 5 sheets: 1) Plot information 2) Bryophyte data with species specific information, separated per substrate 3) Macrolichen data with species specific information, separated per substrate 4) Bryophyte data with species specific information (plot level data). Species lists of the two substrates were merged; if one substrate in a plot hosted a species identified only to genus level (genus spec.) but the second investigated substrate hosted an identified species of the same genus, we removed the genus spec. entry in the particular plot. The species list of sheet 2 and 4 might therefore differ slightly. 5) Macrolichen data with species specific information (plot level data). Species lists of the two substrates were merged; if one substrate in a plot hosted a species identified only to genus level (genus spec.) but the second investigated substrate hosted an identified species of the same genus, we removed the genus spec. entry in the particular plot. The species list of sheet 3 and 5 might therefore differ slightly.22 years ago
- We developed a workflow to generate Large Scale Hazard Simulations for avalanches based on digital elevation models and information on the protective function of the forest. This datasets contains the potential avalanche release areas (PRA) as polygons, the simulation outputs (maximum pressure, maximum flow velocity and maximum flow height) as .tif rasters and the outlines of the simulated avalanches (polygon) for the entire area of the canton of Grisons (7105 km2). The simulations are performed for the scenarios wit return periods of 10, 30, 100 and 300 years, once with (FOR) and once without (NoFor) taking the effect of the forest into account. The details can be found in this publication: Bühler, Y., Bebi, P., Christen, M., Margreth, S., Stoffel, L., Stoffel, A., Marty, C., Schmucki, G., Caviezel, A., Kühne, R., Wohlwend, S., and Bartelt, P.: Automated avalanche hazard indication mapping on state wide scale, Nat. Hazards Earth Syst. Sci. Discuss., 2022, 1-22, 10.5194/nhess-2022-11, 2022.92 years ago
- Two stem core samples of 12 to 20 trees outside the plot of each main species in the plot were taken at breast height (1.3 m above ground) with a SUUNTO corer. Tree ring width and density were determined with the instruments CATRAS and TSAP, the Densitometer DENDRO 2003 and a stereo-microscope. The selected trees included at least 12 pre-dominant or dominant trees and if possible also 4 subdominant or surpressed trees. NOTE: The samplings were carried out between 1996 and 1999 for most plots and in 2003 for the plot Lantsch. The cores cover a time span depending on the age of the oldest trees on a plot. On one plot the oldest sampled tree ring grew in the year 1646. ### Purpose: ### Reconstruction of stand history and tree growth ### Manual Citation: ### * Paolo Cherubini, Matthias Dobbertin, 1997: Bestandesgeschichte (Dendrochronologie). In: Peter Brang (ed.), Aufnahmeanleitung LWF. Langfristige Waldökosystem-Forschung LWF, Eidg. Forschungsanstalt WSL, Birmensdorf, 3 S. * Cherubini, P.; Dobbertin, M., 1998: The Swiss long-term forest ecosystem research: methods for reconstructing forest history. In: Borghetti, M. (ed): Società Italiana di Selvicoltura ed Ecologia Forestale (SISEF), Atti I: 19-22. ### Paper Citation: ### * Cherubini, P., Fontana, G., Rigling, D., Dobbertin, M., Brang, P., Innes, J.L., 2002. Tree-life history prior to death: two fungal root pathogens affect tree-ring growth differently. J. Ecol. 90, 839-850.12 years ago
- Recent publications about declines in arthropod biomass, abundance and species diversity raise concerns and call for measures. Agricultural intensification is likely one cause for the negative trends. But rare long-term arthropod surveys conceal trends in arthropod communities in agricultural land. Here, we report about a standardized sampling of arthropod fauna in a Swiss agricultural landscape, repeated over 32 years (1987, 1997 and 2019). We sampled 8 sites covering 4 semi-natural and agricultural habitat types. Four trap types were used to capture a wide range of flying and ground dwelling arthropods between May and July. Over the three sampling periods, 58’255 specimens of 1’343 species were analysed. Mean arthropod biomass, abundance and species richness per trap was significantly higher in 2019 than in prior years and gamma diversity of the study area was highest in 2019. Biomass and abundance increased stronger in the flight traps than in the pitfall traps. The implementation of agri-environmental schemes has improved habitat quality since 1993, while landscape composition and pesticide and fertilizer use remained stable over the study period, both contributing to the findings. The results of this study contrast with outcomes of comparable investigations and highlight the importance of further long-term investigations on arthropod dynamics. Data are provided on request to contact person against bilateral agreement.222 years ago
- Cloud droplet properties were predicted between February 24 and March 8 2019 for the measurement site Davos Wolfgang (1630 m a.s.l., LON: 9.853594, LAT: 46.835577). Droplet calculations are carried out with the physically based aerosol activation parameterization of Morales and Nenes (2014), employing the “characteristic velocity” approach of Morales and Nenes (2010). Aerosol size distribution observations required to predict the cloud droplet numbers and maximum in-cloud supersaturation are obtained from a Scanning Mobility Particle Size Spectrometer (SMPS) instrument deployed at Davos Wolfgang (https://www.envidat.ch/dataset/aerosol-data-davos-wolfgang). The required vertical velocity measurements are derived from the wind Doppler Lidar (https://www.envidat.ch/dataset/lidar-wind-profiler-data) deployed at the same station and are extracted from the first bin of the instrument, being 200 m above ground level. The hygroscopic properties of the particles measured at Davos Wolfgang could not be estimated, owing to a lack of concurrent CCN measurements. As a sensitivity test, droplet calculations are performed assuming two different values of the aerosol hygroscopicity parameter, 0.1 and 0.25, based on the analysis carried out for Weissfluhjoch. Additional information can be found in Section 2.3 [here](https://acp.copernicus.org/preprints/acp-2020-1036/).22 years ago
- This dataset contains all data, on which the following publication below is based. **Paper Citation**: Neff, F., Resch, M. C., Marty, A., Rolley, J. D., Schütz, M., Risch, A. C, Gossner, M. M. 2020. Long-term restoration success of insect herbivore communities in semi-natural grasslands: a functional approach. Ecological Applications, 30, e02133. [10.1002/eap.2133](https://doi.org/10.1002/eap.2133) Please cite this paper together with the citation for the datafile. # Methods ## Study site The study area is situated within and nearby to Eigental nature reserve (47°27’36” to 47°29’06” N, 8°37’12” to 8°37’44” E, 461 to 507 m a.s.l.) in the vicinity of Zurich airport (Canton Zurich, Switzerland). Mean annual precipitation and temperature is 903 ± 136 mm and 9.14°C ± 0.50°C (mean ± SD for 2007-2017 (*MeteoSchweiz 2018*)). In 1967, the Eigental nature reserve was established to protect small and isolated remnants of species-rich, semi-natural grasslands (roughly 12 ha), which were embedded in an otherwise intensively managed landscape. It is characterized by oligo- to mesotrophic Molinion (semi-wet, matrix species *Molinia caerulea*) and Mesobromion (semi-dry, matrix species *Bromus erectus*) meadows (*Delarze et al. 2015*), reflecting small-scale habitat heterogeneity, mainly due to site-specific groundwater levels and slope inclination. As in most Central European grasslands, management is necessary to prevent shrub and tree invasions as well as to secure low levels of available soil nutrients and thus to maintain these species-rich habitats ([*Poschlod and WallisDeVries 2002*](https://doi.org/10.1016/S0006-3207(01)00201-4)). In 1990, the government of the Canton Zurich decided to enlarge the Eigental nature reserve as a counter measure against degradation and biodiversity loss in semi-natural grasslands due to overutilization and the excessive input of nutrients (mostly nitrogen). Eleven patches of adjacent intensively managed grassland (in total roughly 20 ha) were targeted to be transformed into semi-natural grasslands. As a first restoration measure, fertilization was ceased, and biomass harvested three times to remove excessive soil nutrients from the original system and thus benefit plant species with low competitive ability on the long run. In 1995, the restoration efforts were increased and a large-scale experiment comprising three restoration measures with increasing intervention intensities was implemented: - **Harvest only**: Initial restoration measures were continued with mowing and removing of the aboveground biomass two times a year (early summer and autumn). - **Topsoil**: Removal of topsoil, depending on the thickness of the A horizon the upper 10 to 20 cm, in four randomly selected areas within the eleven patches in late autumn 1995. The size of the restoration area depended on individual patch size (2700 to 7000 m2). - **Topsoil + Propagules**: Plant propagules were added on half of the area where topsoil was removed via application of fresh, seed-containing hay and hand-collected propagules of target species originating from semi-dry and semi-wet species-rich grasslands with local and regional provenance (within radius of 7 to 30 km) (1995, 1996, 1997). Management of *Topsoil* and *Topsoil + Propagules* started five years after treatment implementation and included yearly mowing and removing of aboveground biomass (late summer or early autumn). The experiment was complemented with intensively managed grassland sites that share the same agricultural history as the restored sites (**Initial**; swards dominated by *Lolium perenne*, *L. multiflorum* and *Trifolium repens*): mowing and subsequent fertilizing (manure) up to five times a year, as well as different tillage regimes. Finally, sites were selected in target semi-dry and semi-wet grasslands (**Target**) located within the Eigental nature reserve and another nature reserve nearby (Altläufe der Glatt; 47°28’29” to 47°27’41” N, 8°31’56” to 8°32’26” E, 418 to 420 m a.s.l.). The selected target sites are mown and aboveground biomass removed once a year in late summer or early autumn. For each of the five treatments, we selected eleven plots (5 m × 5 m) spread across the sites. Altogether, the experiment included 55 plots. ## Arthropod sampling Aboveground arthropods were sampled using suction sampling on four consecutive days in early July 2017 before the grasslands were mown. Arthropods were sampled in two locations on each 5 m × 5 m plot, once in the south-western and once in the north-eastern corner to account for possible spatial heterogeneity within the plots. Arthropods were sorted to order or lower taxonomic levels and individuals were identified to species level. We focused on three groups (Hemiptera: Auchenorrhyncha, Hemiptera: Heteroptera, Orthoptera), ## Functional traits We used two sets of functional traits in this study. **Morphometric traits**: Body volume, body shape, hind femur shape, hind/front leg ratio, wing length, leg length, antenna length and eye width. We used trait measurements from [*Simons et al. (2016)*](http://dx.doi.org/10.1890/15-0616.1) and [*Neff et al. (2019)*](https://doi.org/10.1007/s10980-019-00872-1) and complemented them with measurements on study specimens. These measurements were conducted using a high-resolution measuring stereo microscope (Leica DVM6, Leica Microsystems) including automated high-resolution photo stacking with the software Leica Application Suite X (LAS X, © 2018 Leica Microsystems CMS GmbH) and Leica Map Premium (Leica Microsystems, © 1996-2017 Digital Surf) at WSL Birmensdorf. The eight morphometric traits were calculated from direct measurements of body parts on specimens of all sampled species. From each species, we measured at least one female and one male specimen. Additionally, for species that show wing dimorphism, we included the different wing morphs and weighted them by their prevalence reported in literature. For few species, of which not all wing morphs were available for measurements (10 cases), we estimated relative wing length from congeneric species or from the literature. **Life-history traits** Based on an existing data set collected by [*Gossner et al. (2015)*](http://dx.doi.org/10.1890/14-2159.1). We included traits describing different life-history characteristics of herbivore insect species, namely: feeding specialization, feeding tissue, hibernation stage and number of generations per year, which are related to insect species’ vulnerability to changes in plant community composition, microhabitat use and disturbance tolerance. To represent potential changes in habitat moisture with abandonment of intensive land use (e.g., change in ground-water level), we also included two traits related to preferred habitat moisture of the study species: moisture preference, describing species’ optimum habitat moisture, and moisture range, which describes the species’ range of preferable moisture conditions. ### References Delarze, R., Y. Gonseth, S. Eggenberg, and M. Vust. 2015. Lebensräume der Schweiz: Ökologie - Gefährdung - Kennarten. 3rd ed. Ott, Bern. Gossner, M. M., N. K. Simons, R. Achtziger, T. Blick, W. H. O. Dorow, F. Dziock, F. Köhler, W. Rabitsch, and W. W. Weisser. 2015. A summary of eight traits of Coleoptera, Hemiptera, Orthoptera and Araneae, occurring in grasslands in Germany. Scientific Data 2:150013. MeteoSchweiz. 2018. Klimabulletin Jahr 2017. MeteoSchweiz, Zürich. Neff, F., N. Blüthgen, M. N. Chisté, N. K. Simons, J. Steckel, W. W. Weisser, C. Westphal, L. Pellissier, and M. M. Gossner. 2019. Cross-scale effects of land use on the functional composition of herbivorous insect communities. Landscape Ecology 34:2001–2015. Poschlod, P., and M. F. WallisDeVries. 2002. The historical and socioeconomic perspective of calcareous grasslands—lessons from the distant and recent past. Biological Conservation 104:361–376. Simons, N. K., W. W. Weisser, and M. M. Gossner. 2016. Multi-taxa approach shows consistent shifts in arthropod functional traits along grassland land-use intensity gradient. Ecology 97:754–764.32 years ago
- We present stated preference data based on a national representative Swiss online panel survey for the preference of renewable energy infrastructure in landscapes. The data was collected between November 2018 to March 2019 using an online questionnaire and resulted on 1026 responses. The online questionnaire consisted of two main parts – (1) questions covering meanings related to landscapes, nature and renewable energy infrastructure, including the “fit” of landscape/REI combinations and (2) online choice experiment. While in the first part of the questionnaire we asked respondents about their personal connection to certain landscapes, to nature and to specific renewable energy infrastructures, we also asked them to evaluate the fitting of seven different Swiss landscapes (near natural alpine areas, northern alps, touristic alpine areas, agricultural plateau, urban plateau, jura ridges, urban alpine valley) with five different REI (wind, PV ground, PV roof, power lines) combinations. In the second part of the questionnaire, the stated choice experiment confronted respondents with 15 consecutive choice tasks, with each task involving a choice between two “energy system transformation” options and an opt-out option (none). Each choice option (beside the opt-out option) included four unlabeled attributes (landscape, wind energy infrastructure, photovoltaic energy infrastructure, high voltage overhead power line infrastructure) with varying levels. Due to data cleaning procedures (item nonresponse) the number of responses used within hybrid choice modelling and analysis was n=844 (12660 choice observations). An analysis of the hybrid choice model and further insights are presented in the article “How landscape-technology fit affects public evaluations of renewable energy infrastructure scenarios. A hybrid choice model.”62 years ago
- A portable Raman lidar system (Polly) from Leibnitz Institute for Tropospheric Research (Tropos) was deployed at Davos Wolfgang (LON: 9.853594, LAT: 46.835577). Please use this [link](http://polly.tropos.de/?p=lidarzeit&Ort=39), to be directly forwarded to the Davos location and select the date of interest from the calendar (bold numbers). The data can be requested directly at the Polly team.12 years ago
- This data-set contains Land Surface Albedo (LSA) data obtained via a UAV sytem with up and downlooking shortwave radiation sensors, as described in the JGR-Atmospheres paper "Effect of forest canopy structure on wintertime Land Surface Albedo: Evaluating CLM5 simulations with in-situ measurements", by Malle et al. (2021, under review). This publication must be cited when using the data. Data was collected across a large range of forest structures and solar angles in Switzerland (Davos Laret) and in Finland (Sodankylä). For each waypoint location at each site, data includes measured LSA, incoming SWR, reflected SWR and sunlit snow-view fraction alongside zenith angle, azimuth angle and measurement time (local time). Please refer to the abovementioned article for more detailed explanation.22 years ago
- This dataset consist of simulated hourly power production from an Enercon E82 Turbine at 100 m hub-height. It describes the hourly power output a 1MW turbine would produce in each 0.01° grid cell for the years 2016 and 2017. 100 m wind speed data was taken from the COSMO-1 model (Consortium for Small-scale Modeling 2017), which has a 0.01° horizontal resolution. The domain covered is the whole of Switzerland, with the exclusion of lakes. As such, the number of 0.01◦ pixels within Switzerland amounts to 48657. Conversion to power output was done based on the power curve of the Enercon E82 Turbine. As power output is lower at altitude due to lower air density, we corrected for this effect as described in (Kruyt et al. 2017). Please cite the following paper in connection with the dataset: __Paper Citation:__ > _Bert Kruyt, Jérôme Dujardin, and Michael Lehning: Improvement of wind power assessment in complex terrain: The case of COSMO-1 in the Swiss Alps, Front. Energy Res., [doi:10.3389/fenrg.2018.00102] (https://doi.org/10.3389/fenrg.2018.00102)_32 years ago
- The data in this repository was used for the calibration and validation of the SWE2HS model in the following publication: Aschauer, J., Michel, A., Jonas, T., & Marty, C. (2023). An empirical model to calculate snow depth from daily snow water equivalent: SWE2HS 1.0. Geoscientific Model Development Discussions, 1-19. https://doi.org/10.5194/gmd-2022-258 Contains daily snow water equivalent and snow depth timeseries from stations in the European Alps.12 years ago
- The following two tables contain information about the data sources of the values reported in Table 1 and 2 in the paper “Plant and root-zone water isotopes are difficult to measure, explain, and predict: some practical recommendations for determining plant water sources” published in the journal 'Methods in Ecology and Evolution'.22 years ago
- Stemflow (portion of precipitation running down the branches and the trunk and depositing at the base of the tree) can represent a substantial fraction of the total water and nutrient input in stands of smoothbarked species with upright branches. Stemflow was measured with silicone gutters installed on the trunk of 5 trees at three LWF plots during 1-2 years. High capacity containers were used at Novaggio. An automated tipping bucket system, allowing continuous recording of volumes and sampling of representative proportional fraction, is currentlx used at the LWF sites Laegeren, Lausanne, Othmarsingen and Schänis. ### Purpose: ### To quantify the contribution of stemflow to the water and nutrient budget and to the atmospheric deposition in selected forests stands. ### Manual Citation: ### * Thimonier, A., Brang, P., Wenger, K., 1997. Kapitel C4. Atmosphärische Deposition: Freiland- und Bestandesniederschläge, in: Brang, P. (Ed.), Aufnahmeanleitungen aller Forschungsprojekte auf Flächen der Langfristigen Waldökosystem-Forschung (LWF). Eidg. Forschungsanstalt WSL, Birmensdorf, pp. 1-48. * Clarke N, Žlindra D, Ulrich E, Mosello R, Derome J, Derome K, König N, Lövblad G, Draaijers GPJ, Hansen K, Thimonier A, Waldner P, 2016: Part XIV: Sampling and Analysis of Deposition. In: UNECE ICP Forests Programme Co-ordinating Centre (ed.): Manual on methods and criteria for harmonized sampling, assessment, monitoring and analysis of the effects of air pollution on forests. Thünen Institute of Forest Ecosystems, Eberswalde, Germany, 32 p. + Annex [http://icp-forests.net/page/icp-forests-manual](http://icp-forests.net/page/icp-forests-manual)12 years ago
- Dataset (Model input, snow distribution and validation) for the precipitation scaling paper, which should be cited along with the data set citation. This data is useful for distributed hydrological modelling or other tasks that involve the study of snow distribution and precipitation in the high Alpine. The format of the data is for Alpine3D (models.slf.ch) model runs but other models could be used, too. Please cite: _Vögeli, C., Lehning, M., Wever, N., Bavay M., 2016: Scaling Precipitation Input to Spatially Distributed Hydrological Models by Measured Snow Distribution., Front. Earth Sci. 4: 108. doi: 10.3389/feart.2016.00108._ Dataset is provided as a single zip file. The archive contains two directories, the valuable distributed snow depth maps for the landscape Davos and the simulation input. The archive also contains the file: "ReadMeMetadataDataSetPrecipitationScaling" which explains the data structure.12 years ago
- Sampling of deadwood for density and chemical analysis during summer 2009 ### Purpose: ### Determination of N and C pools of deadwood ### Paper Citation: ### * WEGGLER, K.; DOBBERTIN, M.; JÜNGLING, E.; KAUFMANN, E.; THÜRIG, E., 2012. Dead wood volume to dead wood carbon: the issue of conversion factors. European Journal of Forest Research 131, 1423-1438.12 years ago
- Volume of stemwood with bark of all trees and shrubs starting at 12 cm dbh removed from the forest between two inventories due to damage that occurred, in this case insects, and not due to silvicultural planning. This theme is derived on the level of a sample plot from the cuttings of the sample trees and the salvage cut proportion (according to information from the forester). The correction for bias with the sample Tarif trees may be so drastic that it results in negative values with small numbers of trees. __Citation:__ > _Abegg, M.; Brändli, U.-B.; Cioldi, F.; Fischer, C.; Herold-Bonardi, A.; Huber M.; Keller, M.; Meile, R.; Rösler, E.; Speich, S.; Traub, B.; Vidondo, B. (2014). Fourth national forest inventory - result tables and maps on the Internet for the NFI 2009-2013 (NFI4b). [Published online 06.11.2014] Available from World Wide Web http://www.lfi.ch/resultate/ Birmensdorf, Swiss Federal Research Institute WSL. [doi:10.21258/1057112](https://doi.org/10.21258/1057112)_22 years ago
- Number of regeneration trees where browsing of the shoots from the previous year was recorded in NFI’s regeneration survey. __Citation:__ > _Abegg, M.; Brändli, U.-B.; Cioldi, F.; Fischer, C.; Herold-Bonardi, A.; Huber M.; Keller, M.; Meile, R.; Rösler, E.; Speich, S.; Traub, B.; Vidondo, B. (2014). Fourth national forest inventory - result tables and maps on the Internet for the NFI 2009-2013 (NFI4b). [Published online 06.11.2014] Available from World Wide Web http://www.lfi.ch/resultate/ Birmensdorf, Swiss Federal Research Institute WSL. [doi:10.21258/1057112](https://doi.org/10.21258/1057112)_22 years ago
- This is the freely available part of the data used in the publication by Techel et al. (2022): _On the correlation between a sub-level qualifier refining the danger level with observations and models relating to the contributing factors of avalanche danger_ - danger signs - human triggered avalanches - rutschblock test results (still to be added) - extended column test results (still to be added)32 years ago
- Dry weight (mass) of dead, standing trees and shrubs starting at 12 cm dbh. This consists of the tree parts: roots, stemwood and also, depending on the degree of decomposition, the branch coarse wood. __Citation:__ > _Abegg, M.; Brändli, U.-B.; Cioldi, F.; Fischer, C.; Herold-Bonardi, A.; Huber M.; Keller, M.; Meile, R.; Rösler, E.; Speich, S.; Traub, B.; Vidondo, B. (2014). Fourth national forest inventory - result tables and maps on the Internet for the NFI 2009-2013 (NFI4b). [Published online 06.11.2014] Available from World Wide Web http://www.lfi.ch/resultate/ Birmensdorf, Swiss Federal Research Institute WSL. [doi:10.21258/1057112](https://doi.org/10.21258/1057112)_22 years ago
- Predicting future climatic conditions at high spatial resolution is essential for many applications in science. Here we present data for monthly time series of precipitation and minimum and maximum temperature for four downscaled global circulation models. We used model output statistics in combination with mechanistic downscaling (the CHELSA algorithm) to calculate mean monthly maximum and minimum temperatures, as well as monthly precipitation sums at ~5km spatial resolution globally for the years 1850-2100. We validated the performance of the downscaling algorithm by comparing model output with observed climates for the years 1950-2069. CHELSA_cmip5_ts is licensed under a Creative Commons Attribution 2.0 Generic (CC BY 2.0) license.12 years ago
- Meteorological and soil moisture measurements from soil moisture stations installed from October 2010 - October 2013 in the area surrounding Davos, in particular in the Dischma catchment. There are in total 7 stations: 1202, 1203, 1204, 1205, 222, 333 and SLF2. For each of the stations, there is a: * vwc_[stn].smet: containing the soil moisture measurements * station_[stn].smet: in-situ measured meteorlogical parameters. Note, the quality of these measurements for stations 1202, 1203, 1204 and 1205 is very low, with data gaps. Use this data with care. For stations 222, 333 and SLF2, data quality is high and only the default cautiousness should be applied. * interpolatedmeteo_[stn].smet contains per stations a dataset derived by interpolating from several stations in the Davos area to the stations location. This dataset was generated from the output of the Alpine3D model, of which simulations are presented in the Wever et al. (2017) manuscript. At the soil moisture measurement sites, Decagon 10HS sensors were installed, at 10, 30, 50, 80 and 120 cm depth. Per depth 2 sensors were installed, labelled A and B in the datafiles. Note that at stations 1203, 1204 and 1205, sensors were only installed at 10, 30 and 50 cm depth. The files follow the SMET format: https://models.slf.ch/docserver/meteoio/SMET_specifications.pdf and metadata for the stations can be found in the header of the smet files. Please cite the Wever et al. (2017) reference when using this data in publications. For a more detailed description, please refer to: Wever, N., Comola, F., Bavay, M., and Lehning, M.: Simulating the influence of snow surface processes on soil moisture dynamics and streamflow generation in an alpine catchment, Hydrol. Earth Syst. Sci., 21, 4053-4071, https://doi.org/10.5194/hess-21-4053-2017, 2017.12 years ago
- Ground vegetation is an important compartment of the ecosystem in terms of biodiversity and it takes an active part in the general functioning of the ecosystem. It is also a useful bio-indicator of the site conditions and its monitoring may enable the detection of environmental changes. Ground vegetation relevés were repeatedly carried out at 17 LWF plots in the period between 1994 and 2011. In 2013, ground vegetation was surveyed at an additional LWF plot (Laegeren). Phytosociological relevés were carried out in one or two concentric circular plots of 30, 200, 400 and 500 m2. All species occurring on the whole area of the LWF plot were also noted during the first vegetation survey. ### Purpose: ### To assess the species diversity of ground vegetation and detect possible environmental changes using its bio-indicator value. ### Manual Citation: ### * Kull, P., 1997. Kapitel D2. Vegetationsaufnahmen. In: Brang, P. (Ed.), Aufnahmeanleitungen aller Forschungsprojekte auf Flächen der Langfristigen Waldökosystem-Forschung (LWF). Eidg. Forschungsanstalt WSL, Birmensdorf, pp. 1-9. * Canullo R, Starlinger F, Granke O, Fischer R, Aamlid D, 2016: Part VI.1: Assessment of Ground Vegetation. In: UNECE ICP Forests Programme Co-ordinating Centre (ed.): Manual on methods and criteria for harmonized sampling, assessment, monitoring and analysis of the effects of air pollution on forests. Thünen Institute of Forest Ecosystems, Eberswalde, 12 p. + Annex [http://icp-forests.net/page/icp-forests-manual](http://icp-forests.net/page/icp-forests-manual) ### Paper Citation: ### * Thimonier A, Kull P, Keller W, Moser B, Wohlgemuth T (2011) Ground vegetation monitoring in Swiss forests: comparison of survey methods and implications for trend assessments. Environmental Monitoring and Assessment, 174: 47-63. [doi: 10.1007/s10661-010-1759-y](http://doi.org/10.1007/s10661-010-1759-y)12 years ago
- Calculation scripts that perform ensemble hydrograph separation. Identical scripts in R and MATLAB are provided, along with demonstration input time series and the corresponding outputs. These scripts were tested on R version 3.6.2 (2019-12-12) and on MATLAB versions 2018b and 2109b. These scripts are made publicly available under GNU General Public License 3; for details see https://www.gnu.org/licenses/. ETH Zurich, WSL, James Kirchner, and Julia Knapp make ABSOLUTELY NO WARRANTIES OF ANY KIND, including NO WARRANTIES, expressed or implied, that this software is free of errors or is suitable for any particular purpose. Users are solely responsible for determining the suitability and reliability of this software for their own purposes.32 years ago
- This data includes (1) Scripts to aggregate landscape resistance layers into squared and hexagonal grids (i.e., different representations and resolutions), (2) Input resistance layers and focal nodes in .txt format to run in Circuitscape (Python implementation v4.0.5). Circuitscape is a software tool for modeling and analyzing landscape connectivity, which simulates movement of organisms across landscapes by estimating resistance to movement across each point of the landscape. (3) Scripts for the ecological network analysis, and (4) environmental predictors for amphibian whole-life cycle habitats used to describe the local environment for BGI design (i.e. topographic, hydrologic, edaphic, vegetation, land-use derived, movement-ecology related).22 years ago
- This dataset includes discharge and rainfall measurements and deuterium compositions of streamflow, rainfall and groundwater, for four rainfall events and three baseflow snapshot campaigns in the Studibach (Alptal, Switzerland). More specifically, we present the following data: - Specific discharge at the catchment outlet at 5-minute resolution (mm per hour); - Rainfall at 5-minute resolution (mm per hour); - Rainfall deuterium composition (‰); - Stormflow deuterium composition (‰); - Groundwater and baseflow deuterium compositions (‰). For the files containing rainfall and discharge timeseries (QP), and rainfall and streamwater deuterium compositions ("Deuterium_Rainfall" and "Deuterium_Streamwater"), we added the corresponding event identifier (A, B, C or extra) to the file names. For the files containing the groundwater and baseflow deuterium values ("Deuterium_Snapshot") we added the sample collection date to the file name. We included the X and Y coordinates for each data point (coordinate system: CH1903 LV3) as well as the date and time (UTC). More information on the data collection and preparation can be found in Kiewiet et al. (in review). A detailed description of the baseflow snapshot campaigns can also be found in Kiewiet et al., 2019.152 years ago
- Measuring air pollutants in forests is important for evaluating the risk for vegetation in areas not covered by conventional air quality monitoring networks. Ozone measurements are carried out at LWF, applying the harmonized methodologies from UNECE/ICP Forests and running under the 1999 Gothenburg Protocol to Abate Acidification, Eutrophication and Ground-level Ozone. Data are also collected on ozone-induced visible symptoms and other ecosystem properties such as tree growth, nutrition, and biodiversity, as well as climate. This makes this long-term monitoring data series essential for impact assessment and air pollution modelling. ### Purpose: ### Ozone risk assessment: Continuous measurements of ozone concentrations ### Manual Citation: ### * Schaub M, Calatayud V, Ferretti M, Brunialti G, Lövblad G, Krause G, Sanz MJ, 2016: Part XV: Monitoring of Air Quality. In: UNECE ICP Forests Programme Co-ordinating Centre (ed.): Manual on methods and criteria for harmonized sampling, assessment, monitoring and analysis of the effects of air pollution on forests. Thünen Institute of Forest Ecosystems, Eberswalde, Germany, 11 p. + Annex [http://icp-forests.net/page/icp-forests-manual](http://icp-forests.net/page/icp-forests-manual) ### Paper Citation: ### * Schaub M, Häni M, Calatayud V, Ferretti M, Gottardini E (2018) ICP Forests Brief No 3 - Ozone concentrations are decreasing but exposure remains high in European forests. Programme Co-ordinating Centre of ICP Forests, Thu¨nen Institute of Forest Ecosystems. [doi: 10.3220/ICP1525258743000](https://icp-forests.org/pdf/ICPForestsBriefNo2.pdf) * Cailleret M, Ferretti M, Gessler A, Rigling A, Schaub M (2018) Ozone effects on European forest growth – towards an integrative approach. Journal of Ecology. [doi:10.1111/1365-2745.12941](https://doi.org/10.1111/1365-2745.12941) * Calatayud V and Schaub M (2013) Methods for Measuring Gaseous Air Pollutants in Forests. In: Marco Ferretti and Richard Fischer (Eds). Forest Monitoring: Methods for Terrestrial Investigations in Europe with an Overview of North America and Asia, Vol 12, DENS, UK: Elsevier, 2013, pp. 375-384. [doi:10.1016/B978-0-08-098222-9.00019-4](https://doi.org/10.1016/B978-0-08-098222-9.00019-4)12 years ago
- Close Range Remote Sensing Benchmark for different LiDAR and photogrammetric Sensors in a mixed temperate forest. Benchmarks are needed to evaluate the performance of different close-range remote sensing devices and approaches, both in terms of efficiency as well as accuracy. In this study we evaluate the performance of two terrestrial (TLS), one handheld mobile (PLS) and two drone based (UAVLS) laser scanning systems to detect trees and extract the diameter at breast height (DBH) in three plots with a steep gradient in tree and understorey vegetation density. As a novelty, we also tested the acquisition of 3D point-clouds using a low-cost action camera (GoPro) in conjunction with the Structure from Motion (SfM) technique and compared its performance with those of the more costly LiDAR devices.32 years ago
- Backward trajectories were calculated from two positions: Davos Wolfgang (LON: 9.85361, LAT: 46.83551) and Weissfluhjoch (LON: 9.80646 LAT: 46.83304) for the time period February 2 until March 27 2019 using COSMO or ECMWF, respectively.12 years ago
- The dataset as a part of the international project ESPON Digiplan. The aim of this international project is to assess the extent, organisation and financing of digitisation of plan data as well as the use of these data in ESPON member countries. As a part of the in-depth case study, 7 virtual expert interviews in Switzerland and 5 virtual expert interviews in Germany were conducted with experts on the topic of digitisation of plan data. The documents contain the transcripts of the interviews. The transcripts aim to capture the content of the interviews, which is why voice raising and lowering, as well as pauses in the interview, were not specifically recorded. The interviews were conducted in German, therefore the transcripts are also in German.42 years ago
- Cable-based technologies have been a backbone for harvesting on steep slopes. The layout of a single cable road is challenging because one must identify intermediate support locations and heights that guarantee structural safety and operational efficiency while minimizing set-up and dismantling costs. Seilaplan optimizes the layout of a cable road by Seilaplan stands for Cable Road Layout Planner. Seilaplan is able to calculate the optimal rope line layout (position and height of the supports) between defined start and end coordinates on the basis of a digital elevation model (DEM). The program is designed for Central European conditions and is designed on the basis of a fixed suspension rope anchored at both ends. For the calculation of the properties of the load path curve an iterative method is used, which was described by Zweifel (1960) and was developed especially for standing skylines. When testing the feasibility of the cable line, care is taken that 1) the maximum permissible stresses in the skyline are not exceeded, 2) there is a minimum distance between the load path and the ground and 3) when using a gravitational system, there is a minimum inclination in the load path. The solution is selected which has a minimum number of supports in the first priority and minimizes the support height in the second priority. The newly developed method calculates the load path curve and the forces occurring in it more accurately than tools available on the market to date (status 2019) and is able to determine the optimum position and height of the intermediate supports. The reason for the more accurate results of the new tool is the assumption that the skyline is anchored at both end points. Forest cable yarders used in Europe have a skyline that is fixed at both ends. The behaviour of fixed-anchored suspension ropes is very difficult to describe mathematically and cannot be solved analytically. For this reason, simplified linearized assumptions have so far been used in the forestry sector, which corresponds to the behaviour of a weight-tensioned suspension rope and is known as the Pestal method (1961). Weight-tensioned suspension ropes are used for passenger transport. For the calculation of the load path curve we use an iterative method, which was described by Zweifel (1960) and developed especially for fixed anchored suspension ropes. This makes mathematics much more demanding, but leads to more accurate and realistic results. Since there are no current models which describe the installation costs with adequate accuracy, the solution sought is the one which has a minimum number of supports in the first priority and minimises the support height in the second priority (Figure 2). The presented method is the first one, which starts from a fixed anchored supporting rope and identifies the mathematically optimal column layout at the same time. In contrast to methods that assume a weight-tensioned suspension rope, this approach achieves more realistic solutions with longer spans and lower support heights, which ultimately leads to lower installation costs. Background information on rope mechanics and calculation methods is documented in Bont and Heinimann (2012). License: GNU, General Public License, Version 2 or newer. Literature: Bont, L., & Heinimann, H. R. (2012). Optimum geometric layout of a single cable road. European journal of forest research, 131(5), 1439-1448.12 years ago
- Continuous measurement of soil water content at 15, 50 and 70 cm depth in Visp (3 replications) with TDR soil moisture probes (Tektronix 1502 B) from 2001 until 25.04.2013 ### Purpose: ### Improve the available data for the calibration or validation of the water balance models, i.e. the determination of the water flux needed for calculating the leaching fluxes.12 years ago
- We conducted four drone flights in Davos Wolfgang Arelen, in 2020/21 and 2022 to obtain data for the generation of DSMs and orthomosaics at a high resolution. The data was processed with the Agisoft Metashape Professional Software.12 years ago
- Assessment of several chemical soil parameters at the beginning of the monitoring campaign. Most parameters were determined accordung to the manual of ICP-Integrated-Monitoring. The parameters were analysed for all genetic horizons in soil pits and additionally for fixed layers in the Intensive-Monitoring-Plots. In heterogeneous LWF-plots, several soil pits were analysed in order to assess the soil variability of the plot. The manual (in German) for soil sampling and soil analyses is available in www: http://e-collection.ethbib.ethz.ch/view/eth:25622?q=walthert. The results and data of the first soil survey are available (in German) in www: http://e-collection.ethbib.ethz.ch/view/eth:26275?q=walthert. ### Purpose: ### The chemical characterisation of soil matrix down to the paraent material is realised with data from soil pits. The monitoring of the soil matrix in a frequency of roundly 15 years is effected with soil samples from Intensiv-Monitoring-Plots. For soil monitoring, pooled samples with 16 replicats are used down to a depth of 80 cm. The date of the second soil survey is not yet fixed. ### Manual Citation: ### * Walthert L, Lüscher P, Luster J, Peter B (2002) Langfristige Waldökosystem-Forschung LWF. Kernprojekt Bodenmatrix. Aufnahmeanleitung zur ersten Erhebung 1994-1999. ETHZ Zürich, e-collection , Swiss Federal Institute for Forest, Snow and Landscape Research WSL, Birmensdorf, Vol. 269: 56 p. [10.3929/ethz-a-004375470](https://doi.org/10.3929/ethz-a-004375470) ### Paper Citation: ### * Walthert L, Blaser P, Lüscher P, Luster J, Zimmermann S (2003) Langfristige Waldökosystem-Forschung LWF. Kernprojekt Bodenmatrix. Ergebnisse der ersten Erhebung 1994-1999. ETHZ Zürich, e-collection , Swiss Federal Institute for Forest, Snow and Landscape Research WSL, Birmensdorf, Vol. 276: 340 p.12 years ago
- Two stem core samples of 10 trees outside the plot of each main species in the plot were taken at breast height (1.3 m above ground) with a SUUNTO corer. Tree ring width and density were determined with the instruments CATRAS and TSAP, the Densitometer DENDRO 2003 and a stereo-microscope. The selected trees included at least 10 pre-dominant or dominant trees. ### Purpose: ### N and C stable isotope signals ### Paper Citation: ### * Tomlinson, G., Siegwolf, R.T.W., Buchmann, N., Schleppi, P., Waldner, P., Weber, P., 2014. The mobility of nitrogen across tree-rings of Norway spruce (Picea abies L.) and the effect of extraction method on tree-ring d15N and d13C values. Rapid Commun. Mass Spectrom. 28, 1258-1264.12 years ago
- The FlowCapt is an ultra-robust instrument measuring solid particle acoustic mass - flux intensities (g m‾ ² s‾ ¹) and wind speeds (m s‾ ¹). It was deployed at Gotschnagrat (LON: 46.859 LAT: 9.849). The vertical tube with a length of 1 m monitors snowdrift and snow-blowing; and is mounted at a height between 0.1 an 1.1 m above snow surface. The time within each data set is given in UTC+1.62 years ago
- In controlled model forest ecosystems young trees were exposed to heavy metals in the soil and to acid precipitation. On spruce trees Lymantria monacha caterpillars and Cinara pilicornis aphids and on willow Pterocomma pilosum aphids were reared and monitored. Developmental time and fecundity of L. monacha were recorded and in aphids colony growth was measured.12 years ago
- Dry weight (mass) of lying deadwood starting at 7 cm in diameter that does not fulfil the criteria for a tally tree (measurement location of dbh not identifiable or the dbh is less than 12cm). __Citation:__ > _Abegg, M.; Brändli, U.-B.; Cioldi, F.; Fischer, C.; Herold-Bonardi, A.; Huber M.; Keller, M.; Meile, R.; Rösler, E.; Speich, S.; Traub, B.; Vidondo, B. (2014). Fourth national forest inventory - result tables and maps on the Internet for the NFI 2009-2013 (NFI4b). [Published online 06.11.2014] Available from World Wide Web http://www.lfi.ch/resultate/ Birmensdorf, Swiss Federal Research Institute WSL. [doi:10.21258/1057112](https://doi.org/10.21258/1057112)_22 years ago
- combined and cleaned occurrences of marine fish species of the Greater Caribbean and Tropical East Pacific. Data were obtain from the following sources in 2019/2020: https://gbif.org https://idigbio.org https://biogeodb.stri.si.edu/sftep/en/pages https://biogeodb.stri.si.edu/caribbean/en/pages12 years ago
- The purpose of this project was to develop a model to estimate herb layer biomass and carbon stock based on the categorical cover estimate on each NFI sample plot. To this end, biomass and cover of the six main plant groups in the herb layer were collected from 405 1x1 m subplots on 135 study sites (15 sites in 9 strata) which were selected based on a stratified sampling approach. To ensure consistency with NFI methodology, study sites corresponded to the design of regular NFI sample plots and plant cover was estimated by trained field-crew members. Based on the dry weight of the plant biomass and the cover estimate on each subplot, a linear regression model was developed and applied to estimate herb layer biomass on each NFI sample plot.42 years ago
- The dataset contains weather parameters measured at Davos Wolfgang (LON: 9.853594, LAT: 46.835577).12 years ago
- This dataset includes the processed data of the glide-snow avalanche activity and dynamics on Dorfberg (Davos, Switzerland) covering seasons 2008/09 to 2021/22. This dataset was described in the research article: Fees, A., van Herwijnen A., Altenbach, M., Lombardo, M., Schweizer, J.: Glide-snow avalanche characteristics at different time-scales extracted from time-lapse photography, Annals of Glaciology, 91 We extracted the dynamics of opening glide-cracks and the glide-snow avalanche activity from time-lapse photographs. Glide-snow avalanches were separated into surface and interface events using the liquid water content which was simulated with SNOWPACK at 10 virtual stations on Dorfberg.42 years ago
- This data sets contains the Microsoft Kinect data from 15 wind tunnel experiments on wind-packing / wind crust formation. These experiments were performed in the winter 2016/17. The Kinect measures distributed snow depth. The Kinect data is organized per experiment. Each experiment subfolder contains the processed Kinect depth images and some additional files. Please refer to the README for more details on the data. The processing scripts are available for download as well. The scripts are mainly provided as documentation and would need to be adjusted to be used. This dataset is the basis of the following publication: Sommer C.G., Lehning M. & Fierz C. (2018). Wind Tunnel Experiments: Influence of Erosion and Deposition on Wind-Packing of New Snow. Front. Earth Sci. 6:4. doi: 10.3389/feart.2018.0000432 years ago
- __Acknowledgement__: The NEAD format includes NetCDF metadata and is proudly inspired by both SMET and NetCDF formats. NEAD is designed as a long-term data preservation and exchange format. The NEAD specifications were presented at the __"WMO Data Conference 2020 - Earth System Data Exchange in the 21st Century" (Virtual Conference)__. ----------------------- __Summary:__ The Non-Binary Environmental Data Archive (NEAD) format is being developed as a generic and intuitive format that combines the self-documenting features of NetCDF with human readable and writeable features of CSV. It is designed for exchange and preservation of time series data in environmental data repositories. __License:__ The NEAD specifications are released to the public domain under a Creative Commons CC0 "No Rights Reserved" international license. You can reuse the information contained herein in any way you want, for any purposes and without restrictions.42 years ago
- # Background information The Stillberg ecological treeline research site in the Swiss Alps was established in 1975, with the aim to develop ecologically, technically, and economically sustainable reforestation techniques at the treeline to reduce the risk of snow avalanches. In the course of time, additional research aspects gained importance, such as the ecology of the treeline ecotone under global change. Over almost fifty years, research at the Stillberg site combined long-term monitoring of the large-scale high-elevation afforestation with experimental manipulations simulating global change impacts. Besides providing a scientific basis and practical guidelines for high-elevation afforestation, this research has contributed to a comprehensive understanding of ecological processes in the treeline ecotone across different compartments and scales, from individual trees, non-tree vegetation and soils to whole ecosystems, in the context of global change resulting in more than 150 publications. # Dataset generation We compiled a comprehensive list of scientific publications covering research at the Stillberg research site by conducting searches in the literature databases Web of Science and Google Scholar, as well as in the Digital Object Repository of the Swiss Federal Institute for Forest, Snow and Landscape Research WSL (DORA). We compiled all publications about the afforestation experiment, the FACE × warming experiment, the nutrient addition experiment, the G-TREE experiment, as well as other studies related to the Stillberg research site. # Data description The Stillberg bibliography (Stillberg_bibliography_data_v1.csv) comprises a comprehensive list of 276 scientific publications, 91 of them published in peer-reviewed ISI journals. Currently the bibliography comprises literature about the main afforestation experiment, the FACE × warming experiment, the nutrient addition experiment, and the G-TREE experiment, as well as further publications related to the Stillberg research site that have been published until August 2023. The bibliography can be filtered for different categories, e.g., experiment, peer-review, source repository or database, and source title. The bibliography is described in a metadata file (Stillberg_bibliography_metadata_v1.csv). The bibliography along with the metadata file are provided in a ZIP-folder (Stillberg_bibliography_v1.zip).12 years ago
- Number of tree and shrub species starting at 12 cm dbh (diameter at breast height) within the 200 m2 sample plot. __Citation:__ > _Abegg, M.; Brändli, U.-B.; Cioldi, F.; Fischer, C.; Herold-Bonardi, A.; Huber M.; Keller, M.; Meile, R.; Rösler, E.; Speich, S.; Traub, B.; Vidondo, B. (2014). Fourth national forest inventory - result tables and maps on the Internet for the NFI 2009-2013 (NFI4b). [Published online 06.11.2014] Available from World Wide Web http://www.lfi.ch/resultate/ Birmensdorf, Swiss Federal Research Institute WSL. [doi:10.21258/1057112](https://doi.org/10.21258/1057112)_42 years ago
- This python code uses the Finite Element library FEniCS (via docker) to solve the one dimensional partial differential equations for heat and mass transfer in snow. The results are written in vtk format. The dataset contains the code and the output data to reproduce the key Figure 5 from the related publication: _Schürholt, K., Kowalski, J., Löwe, H.; Elements of future snowpack modeling - Part 1: A physical instability arising from the non-linear coupling of transport and phase changes, The Cryosphere, 2022_ The code and potential updates can be accessed directly through git via: https://gitlabext.wsl.ch/snow-physics/snowmodel_fenics12 years ago
- The datasets comprise nearly 19’000 trees of European beech (_Fagus sylvatica_ L.) from unmanaged forests in Switzerland, Germany / Lower Saxony and Ukraine. Tree death was modelled as a function of size and growth, i.e., stem diameter (DBH) and relative basal area increment (relBAI). To explain the spatial and temporal variability in mortality patterns, we considered a large set of environmental and stand characteristics. ## Inventory data The strict forest reserves in Switzerland and Germany had been established in the period of 1961-1975 and 1971-1974, respectively. Every reserve included up to 10 permanent plots ranging from 0.09 to 1.8 ha in size, with slightly irregular re-measurement intervals. Permanent plots with pure or mixed beech stands were selected from the reserves of both networks. Reserves with considerable wind disturbance during the monitored intervals were excluded from the analysis. In addition to data from the Swiss and German reserves, data from a 10 ha plot in the primeval beech forest Uholka in Western Ukraine including three remeasurements were used. The inventory data provide diameter measurements at breast height (dbh) for revisited trees with a diameter of more than 4, 7 and 6 cm for Switzerland, Germany and Ukraine, respectively. ## Mortality predictors A set of three consecutive inventories was used to generate records for the calibration of mortality models based on trees that were alive in the first and second inventory and either dead or alive in the third inventory. As an explanatory variable, the annual relative basal area increment (relBAI) was calculated based on the first and the second dbh measurement as the compound annual growth rate of the trees basal area. Tree dbh in the second inventory was used in addition to relBAI to model tree status (alive or dead) of the third inventory. To increase the generality of the mortality models, we selected environmental variables that are known to have a considerable influence on growth and mortality of beech. We emphasized the effects of water availability using a large set of drought characteristics that were calculated based on the local site water balance. We also related beech mortality to soil pH, temperature, precipitation and growing degree-days. Additionally, we considered stand characteristics that reflect the development stage, competition and structure of the forests. ## Further information For further information, refer to Hülsmann _et al_. (2016) Does one model fit all? patterns of beech mortality in natural forests of three European regions. _Ecological Applications_.42 years ago
- This dataset contains open vector data for railways, forests and power lines, as well an open digital elevation model (DEM) for a small area around a sample forest range in Europe (Germany, Upper Bavaria, Kochel Forest Range, some 70 km south of München, at the edge of Bavarian Alps). The purpose of this dataset is to provide a documented sample dataset in order to demonstrate geospatial preprocessing at FOSS4G2019 based on open data and software. This sample has been produced based on several existing open data sources (detailed below), therefore documenting the sources for obtaining some data needed for computations related to forest accessibility and wood harvesting. For example, they can be used with the open methodology and QGIS plugin [Seilaplan]( https://doi.org/10.16904/envidat.software.1) for optimising the geometric layout cable roads or with additional open software for computing the forest accessibility for wood harvesting. The vector data (railways, forests and power lines) was extracted from OpenStreetMap (data copyrighted OpenStreetMap contributors and available from https://www.openstreetmap.org). The railways and forests were downloaded and extracted on 18.05.2019 using the open sources QGIS (https://www.qgis.org) with the QuickOSM plugin, while the power lines were downloaded a couple of days later on 23.05.2019. Additional notes for vector data: Please note that OpenStreeMap data extracts such as forests, roads and railways (except power lines) can also be downloaded in a GIS friendly format (Shapefile) from http://download.geofabrik.de/ or using the QGIS built-in download function for OpenStreetMap data. The most efficient way to retrieve specific OSM tags (such as power=line) is to use the QuickOSM plugin for QGIS (using the Overpass API - https://wiki.openstreetmap.org/wiki/Overpass_API) or directly using overpass turbo (https://overpass-turbo.eu/). Finally, the digitised perimeter of the sample forest range is also made available for reproducibility purposes, although any perimeter or area can be digitised freely using the QGIS editing toolbar. The DEM was originally adapted and modified also with QGIS (https://www.qgis.org) based on the elevation data available from two different sources, by reprojecting and downsampling datasets to 25m then selecting, for each individual raster cell, the elevation value that was closer to the average. These two different elevation sources are: - Copernicus Land Monitoring Service - EU-DEM v.1.1 (TILE ID E40N20, downloaded from https://land.copernicus.eu/imagery-in-situ/eu-dem/eu-dem-v1.1; this original DEM was produced by the Copernicus Land Monitoring Service “with funding by the European Union” based on SRTM and ASTER GDEM) - Digitales Geländemodell 50 m Gitterweite (https://opendata.bayern.de/detailansicht/datensatz/digitales-gelaendemodell-50-m-gitterweite/), produced by the Bayerische Vermessungsverwaltung – www.geodaten.bayern.de –and downloaded from http://www.geodaten.bayern.de/opendata/DGM50/dgm50_epsg4258.tif This methodology was chosen as a way of performing a basic quality check, by comparing the EU-DEM v.1.1 derived from globally available DEM data (such as SRTM) with more authoritative data for the randomly selected region, since using authoritative data is preferred (if open and available). For other sample regions, where authoritative open data is not available, such comparisons cannot longer be performed. Additional notes DEM: a very good DEM open data source for Germany is the open data set collected and resampled by Sonny (sonnyy7@gmail.com) and made available on the Austrian Open Data Portal http://data.opendataportal.at/dataset/dtm-germany. In order to simplify end-to-end reproducibility of the paper planned for FOSS4G2019, we use and distribute an adapted (reprojected and resampled to 25 meters) sample of the above mentioned dataset for the selected forest range. This sample dataset is accompanied by software in Python, as a Jupiter Notebook that generates harmonized output rasters with the same extent from the input data. The extent is given by the polygon vector dataset (Perimeter). These output rasters, such as obstacles, aspect, slope, forest cover, can serve as input data for later computations related to forest accessibility and wood harvesting questions. The obstacles output is obtained by transforming line vector datasets (railway lines, high voltage power lines) to raster. Aspect and slope are both derived from the sample digital elevation model.82 years ago
- The data set contains the data used in the publication "On snow stability interpretation of Extended Column Test results" by Techel et. al. (2020), published in Natural Hazards Earth System Sciences.22 years ago
- A national vegetation height model was calculated for Switzerland using digital aerial images. We used the stereo aerial images acquired by the Federal Office of Topography swisstopo using the ADS80 sensor to first calculate a digital surface model (DSM) with a very high spatial resolution (1 × 1 m and 0.5 x 0.5 m). The DSM was then normalized to obtain the actual vegetation heights using a digital terrain model (DTM) based on laser data with the buildings masked out, and to produce a vegetation height model (VHM). Such a model will be calculated in the framework of the Swiss National Forest Inventory (NFI) with consistent methods and a very high level of detail. For covering the whole of Switzerland, we use summer aerial images from six years. Latest version is from 2019.62 years ago
- This dataset contains the results of a case study analysing the potential impacts of a compound meteorological extreme event on the protective forest in the Val Mesolcina. These impacts were assessed in an experts survey. 29 Experts from practice, administration and science estimated the probabilities for a loss of the protective function due to a drought-related compound extreme event based on different hazard scenarios. The experts not only assessed these probabilities but also provided estimates about the reliability of the scenarios, other socio-economic consequences and options for adaptation. This dataset contains the following information: - Table with all (anonymised) answers from the survey - Factsheets summarising the results and methods in German, French and Italian - A detailed description of the study site and survey instructions - Link to the project website wit illustrations for each individual question of the survey82 years ago
- This dataset includes data from three vegetation surveys in a restored raised bog (Hagenmoos) in the lowland of the canton of Zürich (Switzerland). The bog Hagenmoos was restored by cutting shrubs and trees within the formerly peat-cutting pits and by blocking drainages. The vegetation surveys were carried out before (1989), ten years after (1999) and 30 years after restoration (2020). In each vegetation survey, all vascular plant and bryophyte species within 72 permanent plots were recorded. Of these plots, 34 are located within the formerly peat-cutting pits and 38 are located outside the peat pits. Based on presence-absence data of vascular plants and bryophytes, mean ecological indicator and strategy values based on Landolt et al. (2010) were calculated and are provided in the Excel sheet. Indicator values for light, moisture, pH, nutrients, humus, temperature and continentality and strategy values for stress, competition and ruderality were considered. Furthermore, species richness for the following groups were calculated: (1) all plant species, (2) all vascular plant species, (3) bog specialists among vascular plant species, (4) all bryophyte species, (5) bog specialists among bryophyte species. As bog specialist species, we considered all plant species listed as characteristic species of raised bogs by Feldmeyer-Christe and Küchler (2018: Moore der Schweiz. Haupt, Bern).12 years ago
- This data contain volumes, solutes and isotopes of snowpack outflow measured by a snowmelt lysimeter system at three locations in the southern Alp catchment, situated Central Switzerland. The river Alp is a snow-dominated catchment situated in Central Switzerland characterized by an elevation range from 840 to 1898 m a.s.l. The dataset provides solutes (major anions and cations, trace metals) and stable water isotopes and water fluxes (snowpack outflow volumes) at daily intervals from several sampling locations. Additionally, the data measured by the snowmelt lysimeter system are provided in 10-minute resolution.22 years ago
- The EFM network is one of the longest running scientific projects in Switzerland and has been collecting growth and yield data since the late 1880’s. As of 2021, 28 plots had been monitored for at least 100 years and 81 for at least 75 years. The network is used to examine silvicultural treatments across a range of species, climate and edaphic conditions. There are currently 465 plots covering a total area of 148 hectares. Over the > 130-year history of the project, at least another 1000 plots were monitored and then deactivated after they reached their experimental goal (e.g. end of the rotation). The data from all 1480 plots are available for analyses.32 years ago
- Wind-Topo is a statistical downscaling model for near surface wind fields especially suited for highly complex terrain. It is based on deep learning and was trained (calibrated) using the hourly wind speed and direction from 261 automatic measurement stations (IMIS and SwissMetNet) located in Switzerland. The periods 1st October 2015 to 1st October 2016 and 1st October 2017 to 1st October 2018 were used for training. The model was validated using 60 other stations on the period 1st October 2016 to 1st October 2017. Wind-Topo was trained using COSMO-1 data and a 53-meter Digital Elevation Model as input. This dataset provides all the necessary code to understand, use and incorporate Wind-Topo in a new downscaling scheme. Specifically, the dataset contains the architecture of Wind-Topo and its optimized parameters, as well as a python script to downscale uniform wind fields with a prescribed vertical profile for any given 53-meter DEM. Accompanies the publication "Wind-Topo: Downscaling near-surface wind fields to high-resolution topography in highly complex terrain with deep learning" Dujardin and Lehning, Quarterly Journal of the Royal Meteorological Society, 2022. https://doi.org/10.1002/qj.4265 Please cite this publication if you use Wind-Topo or derive new models from it. The code can be used under the GNU Affero General Public License (AGPL).12 years ago
- Data of a survey of flowering plants in 80 sites in five European cities and urban agglomerations (Antwerp, Belgium; greater Paris, France; Poznan, Poland; Tartu, Estonia; and Zurich, Switzerland) sampled between April and July 2018.32 years ago
- High quality meteorological data are needed for long-term forest ecosystem research, particularly in the light of global change. The long-term data series published here comprises almost 20 years of measurements for two meteorological stations in Novaggio in Switzerland where one station is located within a natural deciduous forest stand (NOB) with Turkey oak (_Quercus cerris_; 70 yrs), sweet chestnut (_Castanea sativa_; 90 yrs) and silver birch (_Betula pendula_; 70 yrs) as dominant tree species. A second station is situated in the very vicinity outside of the forest (field station, NOF). The meteorological time series are presented in hourly time resolution of air temperature, relative humidity, precipitation, photosynthetically active radiation (PAR) and wind speed. Novaggio is part of the Long-term Forest Ecosystem Research Programme (LWF) established and maintained by the Swiss Federal Research Institute WSL.72 years ago
- The present dataset is part of the published scientific paper Hersperger, A.M., Bürgi, M., Wende, W., Bacău, S. and Grădinaru, S.R., 2020. Does landscape play a role in strategic spatial planning of European urban regions?. Landscape and Urban Planning, 194, p.103702. The goal of this research was to assess the role of landscape in contemporary strategic spatial planning. In order to assess the role of “landscape” in the strategic spatial plans, we focused on how plans took advantage of landscape’s integrative power, how plans are based on knowledge on functioning of landscape systems, and how plans show the contribution of landscapes to human well-being. For each aspect, a number of items (detailed in Table 1 of the paper) were selected to assist the assessment. This study is based on content analysis of the strategic spatial plans of 18 European urban regions. The strategic spatial plans were retrieved from the planning authorities’ websites. The cases study regions as well as the analyzed strategic spatial plans are presented in Table 2 of the paper. The authors developed a protocol containing 28 items, out of which 16 were directly derived from information presented in Table 1. As a result, we provide the following outputs: • Protocol_items.docx – freely available - Detailed description of all the protocol items used to conduct the analysis. • Coding results.xlsx – available on request - Results of the coding procedure. Data were used to create Figures 2, 3, 4, 5, 6 and to qualitatively present the results in the research paper.22 years ago
- ### UAV-derived DSMs and orthoimages Unmanned Aerial Vehicle (UAV) surveys were conducted between 2015 and 2016 on the __Sankt Annafirn__, __Findelen-__ and __Griesgletscher__, situated in the __Swiss Alps__. Three surveys at the Sankt Annafirn allowed for a full glacier coverage, four surveys at Griesgletscher allowed an almost full glacier coverage and seven surveys at Findelengletscher allowed for a partial coverage of the glacier tongue (see individual datasets for exact extent). For each survey, a __high resolution orthoimage__ and a __Digital Surface Model (DSM)__ was created. ### UAV surveys: Prior flight, Ground Control Points (GCPs) were deployed on the glacier surface and measured with a differential GPS (Trimble R7 or Leica GPS 1200). They allowed precise georeferencing of the UAV-derived datasets. UAV flight plans were planned with the software *eMotion 2* and a SenseFly eBee was used as surveying platform. The images were then processed with the software Agisoft Photoscan Pro 1.1.6 . The location and dates of each survey can be found in the table together with the number of flights performed (Nflights), the number of acquired images (Nimages), the number of GCPs set (NGCPs) and the surveyed area. A folder for each dataset is available (see folder name in table), which contains: - An orthoimage __*glacier_date_photoscan_oi_CH1903+_LV95_0.1m.tif*__ - A Digital Surface Model __*glacier_date_photoscan_dsm_CH1903+_LV95_0.1m.tif*__ - The Agisoft Photoscan automatic processing report __*glacier_date_photoscan_report.pdf*__ where: - __*glacier*__ is the name of the surveyed glacier - __*date*__ is the date of the UAV image acquisition - __*photoscan*__ is the name of the photogrammetric software - __*oi*__ or __*dsm*__ the type of dataset - __*CH1903+_LV95*__ is the coordinate system and datum of the dataset - __*0.1m*__ is the resolution of the dataset in meter - __*.tif*__ is the extention of the dataset Details about the UAV surveys, the image processing and the accuracy of the UAV-derived products can be found in this publication below. __Paper Citation:__ > _Gindraux et al. 2017. Accuracy Assessment of Digital Surface Models from Unmanned Aerial Vehicles’Imagery on Glaciers, Remote Sensing, 9, 186, 1-15, [doi: 10.3390/rs9020186](https://doi.org/10.3390/rs9020186)._ The folder UAV_flight_paths.zip contains all UAV flights performed on the Sankt Annafirn, Findelengletscher and Griesgletscher. The flights were planned with the software eMotion2 and have the .afp extention.172 years ago
- These data include all avalanches that were mapped in the region of Davos, Switzerland during the winters 1998-1999 to 2018-2019 (21 years), in total 13,918 avalanches, and the corresponding forecast danger level valid on the day of avalanche occurrence, 3533 days and danger ratings in total. This avalanche activity data set was analysed and results published by Schweizer et al. (2020). They found that the number of avalanches per day strongly increased with increasing danger level, but avalanche size was poorly related to avalanche danger level. The data are provided in two files: the first includes the avalanche data (13,918 records); the second includes the avalanche activity per day (3533 records). Please refer to the Read-me file for further details on the data. These data are the basis of the following publication: Schweizer, J., Mitterer, C., Techel, F., Stoffel, A. and Reuter, B., 2020. On the relation between avalanche occurrence and avalanche danger level. The Cryosphere, 14, 737-750, https://doi.org/10.5194/tc-14-737-2020.32 years ago
- # Input data for the following research article: Impact assessment of homogenised snow depth series on trends The data consists of separate output files from the following homogenisation methods: * Climatol * HOMER * interpQM The variable is seasonal mean snow depth (HSavg) plot.data is an additional data frame containing trends of HSavg (station, method, value, pvalue, altitude)12 years ago
- The present dataset is part of the published scientific paper entitled “The role of spatial planning in land change: An assessment of urban planning and nature conservation efficiency at the southeastern coast of Brazil” (Pierri Daunt, Inostroza and Hersperger, 2021). In this work, we evaluated the conformance of stated spatial planning goals and the outcomes in terms of urban compactness, basic services and housing provision, and nature conservation for different land-use strategies. We evaluate the 2005 Ecological-Economic Zoning (EEZ) and two municipal master plans from 2006 in a coastal region in São Paulo State, Brazil. We used Partial Least Squares Path Modelling (PLS-PM) to explain the relationship between the plan strategies and land-use change ten years after implementation in terms of urban compactness, basic services and housing increase, and nature conservation. We acquired the data for the explanatory variables from different sources listed on Table 1. Since the model is spatially explicit, all input data were transformed to a 30 m resolution raster. Regarding the evaluated spatial plans, we acquired the zones limits from the São Paulo State Environmental Planning Division (CPLA-SP), Ilhabela and Ubatuba municipality. 1) Land use and cover data: Urban persistence, Urban axial, Urban infill, Urban Isolates, Forest cover persistence, Forest cover gain, NDVI increase We acquired two Landsat Collection 1 Higher-Level Surface Reflectance images distributed by the U.S. Geological Survey (USGS), covering the entire study area (paths 76 and 77, row 220, WRS-2 reference system, https://earthexplorer.usgs.gov/). We classified one image acquired by the Landsat 5 Thematic Mapper (TM) sensor on 2005-05-150, and one image from the Landsat 8 Operational Land Imager (OLI) sensor from 2015-08-15. We collected 100 samples for forest cover, 100 samples for built-up cover and 100 samples for other classes. We then classified these three classes of land cover at each image date using the Support Vector Machine (SVM) supervised algorithm (Hsu et al., 2003), using ENVI 5.0 software. Land-use and land-cover changes from 2005 to 2015 were quantified using map algebra, by mathematically adding them together in pairs (10*LULC2015 + LULC2005). We reclassified the LULC data into forest gain (conversion of any 2005 LULC to forest cover in 2015); forest persistence (2005 forested pixels that remained forested in 2015); new built-up area (conversion of any 2005 LULC to built-up in 2015); and urban maintenance (2005 built-up pixels that remained built-up in 2015). To describe the spatial configuration of the urban expansion, we classified the new built-up areas into axial, infill and isolated, following Inostroza et al. (2013) (For details, please refer to Supplementary Material I at the original publication). The NDVI was obtained from the same source used for the LULC data. With the Google Engine platform, we used an annual average for the best pixels (without clouds) for 2005 and 2015, and we calculated the changes between dates. We used increases of > 0.2 NDVI to represent an improvement in forest quality. 2) Federal Census data organization: Urban Basic Services and Housing indicator, socioeconomic and population: The data used to infer the values of basic services provision, socioeconomic and population drivers was derived from the Brazilian National Census data (IBGE, 2000 and 2010). Population density, permanent housing unit density, mean income, basic education, and the percentage of houses receiving waste collection, sanitation and water provision services, called basic services in the context of this study, were calculated per 30 m pixel. The Human Development Index is only available at the municipality level. We attributed the HDI for the vector file with the municipality border, and we rasterized (30 m resolution) this file in QGIS. Annual rates of change were then calculated to allow comparability between LULC periods. To infer the BSH, we used only areas with an increase in permanent housing density and basic services provision (See Supplementary Material I at the original publication). 3) Topographic drivers To infer the values of the topographic driver, we used the slope data and the Topographic Index Position (TPI) based on the digital elevation model from SRTM (30 m resolution) produced by ALOS (freely available at eorc.jaxa.jp/ALOS/en/about/about_index.htm), and both variables were considered constant from 2005 to 2015 (See Supplementary Material I at the original publication).222 years ago
- This data set includes GPS-derived snow water equivalent (SWE), snow depth (HS) and liquid water content (LWC) data for three entire snow-covered seasons (2015-2016, 2016-2017, 2017-2018) at the study plot Weissfluhjoch 2540 m a.s.l. (Davos, Switzerland). The procedure to derive these snow properties is described in Koch et al. (2019). The novel approach is based on a combination of GPS signal attenuation and time delay. The dataset also includes corresponding validation data for SWE and HS measured at Weissfluhjoch, and some additional meteorological data used for interpretation of the snow cover evolution. Please refer to the Read-me file for further details on the data. These data are the basis of the following publication: > Koch, F., Henkel, P., Appel, F., Schmid, L., Bach, H., Lamm, M., Prasch, M., Schweizer, J., and Mauser, W., 2019. Retrieval of snow water equivalent, liquid water content and snow height of dry and wet snow by combining GPS signal attenuation and time delay. Water Resources Research, 55(5), 4465-4487. https://doi.org/10.1029/2018WR02443122 years ago
- The Swiss forests' water availability during the 2015 and 2018 droughts was modelled by implementing the mechanistic Soil-Vegetation-Atmosphere-Transport (SVAT) model LWF-Brook90 taking advantage of regionalized depth-resolved soil information and measured soil matric potential and eddy covariance data. Data include 1) csv of soil matrix potential and eddy covariance data, 2) csv of posterior model parameters, 3) geotiffs of plant-available water storage capacity until 1m soil depth and the potential rooting depth, 4) geotiffs of yearly average (2014-2019) of precipitation (P), actual evapotranspiration (ETa), evaporation as the sum of soil, snow and interception evaporation (E), actual transpiration (Ta), runoff (F) and total soil water storage (SWAT), 5) csv of simulated root water uptake aggregated for different soil depths per deciduous and coniferous trees across Switzerland at daily resolution and cumulative root fraction per soil depth for coniferous and deciduous sites, 6) geotiffs of the ratio of actual to potential transpiration (-) as mean of non-drought years 2014, 2016, 2017, 2019 and 2015 and 2018 for the month June, July, August, September and October, 7) geotiff of mean soil matric potential in the rooting zone in August 2018, 8) geotiffs of gravitational water capacity (mm) until 1 m soil depth and the maximum rooting depth (mrd), 9) geotiffs of uncertainties of the available water storage capacity (AWC) until 1m soil depth and the mean maximum rooting depth (mrd), 10) csv of average plant available - (AWC), gravitational (GWC) and residual (RES) water capacity per soil depth layer of the Swiss forest.112 years ago
- Measuring air pollutants in forests is important for evaluating the risk for vegetation in areas not covered by conventional air quality monitoring networks. Ozone-induced symptoms are being assessed at LWF, applying the harmonized methodologies from UNECE/ICP Forests and running under the 1999 Gothenburg Protocol to Abate Acidification, Eutrophication and Ground-level Ozone. Data are also collected on ozone concentrations and other ecosystem properties such as tree growth, nutrition, and biodiversity, as well as climate. This makes this long-term monitoring data series essential for impact assessment and air pollution modelling. ### Purpose: ### Ozone risk assessment, i.e. to investigate relationships between ozone exposures and ozone-induced, visible symptoms ### Manual Citation: ### * Schaub M, Calatayud V, Ferretti M, Brunialti G, Lövblad G, Krause G, Sanz MJ, 2016: Part VIII: Monitoring of Ozone Injury. In: UNECE ICP Forests Programme Co-ordinating Centre (ed.): Manual on methods and criteria for harmonized sampling, assessment, monitoring and analysis of the effects of air pollution on forests. Thünen Institute of Forest Ecosystems, Eberswalde, Germany, 14 p. + Annex [http://icp-forests.net/page/icp-forests-manual](http://icp-forests.net/page/icp-forests-manual) ### Paper Citation: ### * Schaub M, Häni M, Calatayud V, Ferretti M, Gottardini E (2018) ICP Forests Brief No 3 - Ozone concentrations are decreasing but exposure remains high in European forests. Programme Co-ordinating Centre of ICP Forests, Thu¨nen Institute of Forest Ecosystems. [doi: 10.3220/ICP1525258743000](https://icp-forests.org/pdf/ICPForestsBriefNo2.pdf) * Schaub M and Calatayud V (2013) Assessment of Visible Foliar Injury Induced by Ozone. In: Marco Ferretti and Richard Fischer (Eds). Forest Monitoring: Methods for Terrestrial Investigations in Europe with an Overview of North America and Asia, Vol 12, DENS, UK: Elsevier, 2013, pp. 205-221. ISBN: 9780080982229. [doi: 10.1016/B978-0-08-098222-9.00011-X](https://doi.org/10.1016/B978-0-08-098222-9.00011-X)12 years ago
- Outlines of 6'041 avalanches mapped from SPOT6 satellite data over the Swiss Alps on 16 January 2019. The dataset was acquired following a period with very high avalanche danger. The outlines have different attributes described in the data example key (ExampleKey_AvalMapping16012019.pdf) The generation of the data is described in: Bühler, Y., E. D. Hafner, B. Zweifel, M. Zesiger, and H. Heisig (2019), Where are the avalanches? Rapid SPOT6 satellite data acquisition to map an extreme avalanche period over the Swiss Alps, The Cryosphere, 13(12), 3225-3238, doi:10.5194/tc-13-3225-2019. The data was comprehensivly validated in a subset area in Hafner, E.D.; Techel, F.; Leinss, S.; Bühler, Y., 2021: Mapping avalanches with satellites - evaluation of performance and completeness. Cryosphere, 15, 2: 983-1004. doi: 10.5194/tc-15-983-202112 years ago
- Description of several morphological soil properties at the beginning of the monitoring campaign. The properties were described for all genetic horizons in soil pits if possible down to the parent material. In heterogeneous LWF-plots, several soil profiles were described in order to assess the soil variability of the plot. The manual (in German) for soil sampling and soil analyses is available in www: http://e-collection.ethbib.ethz.ch/view/eth:25622?q=walthert. The results and data of the first soil survey are available (in German) in www: http://e-collection.ethbib.ethz.ch/view/eth:26275?q=walthert. ### Purpose: ### Morphological soil properties are important for the calculation or interpretation of chemical or physical soil properties or processes. For instance, root distribution is an important input-parameter of water balance models or soil hydromorphy strongly affects the chemical status of soil matrix and soil solution. ### Manual Citation: ### * Walthert L, Lüscher P, Luster J, Peter B (2002) Langfristige Waldökosystem-Forschung LWF. Kernprojekt Bodenmatrix. Aufnahmeanleitung zur ersten Erhebung 1994-1999. ETHZ Zürich, e-collection , Swiss Federal Institute for Forest, Snow and Landscape Research WSL, Birmensdorf, Vol. 269: 56 p. [10.3929/ethz-a-004375470](https://doi.org/10.3929/ethz-a-004375470) ### Paper Citation: ### * Walthert L, Blaser P, Lüscher P, Luster J, Zimmermann S (2003) Langfristige Waldökosystem-Forschung LWF. Kernprojekt Bodenmatrix. Ergebnisse der ersten Erhebung 1994-1999. ETHZ Zürich, e-collection , Swiss Federal Institute for Forest, Snow and Landscape Research WSL, Birmensdorf, Vol. 276: 340 p.12 years ago
- Number of all living and dead trees and shrubs starting at 12 cm dbh where a particular cause of damage (including no damage, dead or lying) was determined. One tree may have damage with more than one type of origin, which means it may contribute to the total number of stems with damage with several different types of origin. __Citation:__ > _Abegg, M.; Brändli, U.-B.; Cioldi, F.; Fischer, C.; Herold-Bonardi, A.; Huber M.; Keller, M.; Meile, R.; Rösler, E.; Speich, S.; Traub, B.; Vidondo, B. (2014). Fourth national forest inventory - result tables and maps on the Internet for the NFI 2009-2013 (NFI4b). [Published online 06.11.2014] Available from World Wide Web http://www.lfi.ch/resultate/ Birmensdorf, Swiss Federal Research Institute WSL. [doi:10.21258/1057112](https://doi.org/10.21258/1057112)_22 years ago
- High resolution, downscaled climate model data are used in a wide variety of applications in environmental sciences. Here we present the CHELSA-TraCE21k downscaling algorithm to create global monthly climatologies for temperature and precipitation at 30 arcsec spatial resolution in 100 year time steps for the last 21,000 years. Paleo orography at high spatial resolution and at each timestep is created by combining high resolution information on glacial cover from current and Last Glacial Maximum (LGM) glacier databases with the interpolation of a dynamic ice sheet model (ICE6G) and a coupling to mean annual temperatures from CCSM3-TraCE21k. Based on the reconstructed paleo orography, mean annual temperature and precipitation was downscaled using the CHELSA V1.2 algorithm. The data is published under a Creative Commons Attribution 2.0 Generic (CC BY 2.0) license.32 years ago
- We conducted an experimental rockfall campaign on a forested slope with deadwood and on with the windthrown area cleared in Schiers (CH). Two different rock categories were used: natural rocks with masses between 30 and 85 kg and artificial EOTA-concrete rocks with rock masses ranging from 45 kg up to 3200 kg. In contrast to the intended research article publication, also all information about the experimental runs of the smaller rock masses are available. Besides the geometries of those rocks, the data set contains three LiDAR point clouds, orthophotos, the release point (and release line used in RAMMS), the retrieved single tree positions with DBH, and energy absorption threshold, video footage, and all reconstructed trajectories.112 years ago
- ## Dataset This dataset is based on terrestrial laser scanning (TLS) data acquired during winter 2020/2021 in leaf-off conditions, with a Leica BLK 360 instrument following a tree-centric scanning pattern. The data was acquired on two sites (47.42°N 8.49°E and 47.504°N, 7.78°E), both of which were managed mixed temperate forest stands. Individual trees were semi-automatically segmented from the co-registered TLS point clouds. ## Background Accurate estimates of individual tree volume or biomass within forest inventories are essential for calibration and validation of biomass mapping products based on Earth observation data. Terrestrial laser scanning (TLS) enables detailed and non-destructive volume estimation of individual trees, with existing approaches ranging from simple geometrical features to virtual 3D reconstruction of entire trees. Validating such approaches with weight measurements is a key step before the integration of TLS or other close-range technologies into operational applications such as forest inventories. In this study, we firstly evaluate individual tree volume estimation approaches based on 3D reconstruction through quantitative structure models (QSM) against destructive reference data of 60 trees and compare them to operational allometric scaling models (ASM). Secondly, we determine the explanatory power of TLS-derived geometric parameters regarding total tree, stem, coarse wood and fine branch volume.42 years ago
- Volume of stemwood with bark of all dead trees and shrubs (standing and lying) starting at 12 cm dbh. Unlike this theme , the "Amount of deadwood according to the method of NFI3" includes all lying deadwood starting at 7 cm in diameter. __Citation:__ > _Abegg, M.; Brändli, U.-B.; Cioldi, F.; Fischer, C.; Herold-Bonardi, A.; Huber M.; Keller, M.; Meile, R.; Rösler, E.; Speich, S.; Traub, B.; Vidondo, B. (2014). Fourth national forest inventory - result tables and maps on the Internet for the NFI 2009-2013 (NFI4b). [Published online 06.11.2014] Available from World Wide Web http://www.lfi.ch/resultate/ Birmensdorf, Swiss Federal Research Institute WSL. [doi:10.21258/1057112](https://doi.org/10.21258/1057112)_32 years ago
- In the dry Pfynwald forest a long-term experiment of WSL was initiated in 2003 with a set of irrigated and non-irrigated plots. Forest Entomologie WSL made several investigations, one of them on the effect of irrigation (or conversely of drought) on the biodiversity of epigaeic arthropods such as ground beetles and spiders. In addition, its effects were also assessed by counting galls formed by gall wasps on pubescent oak.12 years ago
- This dataset comprises of a post-processed set of terrestrial laser scans (TLS’s) of Antarctic sea ice obtained during the Sea Ice Physics and Ecosystem Experiment-2 (SIPEX-2, http://seaice.acecrc.org.au/sipex2012/) in September-November 2012. The post-processing steps include the registration of the individual scans into a single 3-dimensional point cloud, the removal of unwanted noise caused by particles in the air (i.e., snow crystals), and the final generation of surface grids based on the cleaned individual point returns. The final product includes the ‘xyz’ coordinates of the individual point measurements, and gridded surfaces covering study areas of 100m x 100 m, and at resolutions of 0.01 m, 0.1 m, 0.25 m, 0.5 m and 1 m for each of the survey dates. Additionally, subgrid statistics that include the mean elevation, standard deviation, minimum and maximum elevations, range, and number of point returns in each gridcell are generated. The final product is provided in space-delimited text files, with the surface grids provided in Digital Terrain Model (DTM) format ready for visualization in any GIS software. ###How to cite: Please also cite the original publication when using this data set.: Trujillo, E., K. Leonard, T. Maksym, and M. Lehning (2016), Changes in snow distribution and surface topography following a snowstorm on Antarctic sea ice, J. Geophys. Res. Earth Surf., 121, doi:[10.1002/2016JF003893](https://dx.doi.org/10.1002/2016JF003893).32 years ago
- # Overview The CH2014-Impacts initiative is a concerted national effort to describe impacts of climate change in Switzerland quantitatively, drawing on the scientific resources available in Switzerland today. The initiative links the recently developed Swiss Climate Change Scenarios CH2011 with an evolving base of quantitative impact models. The use of a common climate data set across disciplines and research groups sets a high standard of consistency and comparability of results. Impact studies explore the wide range of climatic changes in temperature and precipitation projected in CH2011 for the 21st century, which vary with the assumed global level of greenhouse gases, the time horizon, the underlying climate model, and the geographical region within Switzerland. The differences among climate projections are considered using three greenhouse gas scenarios, three future time periods in the 21st century, and three climate uncertainty levels (Figure 1). Impacts are shown with respect to the reference period 1980-2009 of CH2011, and add to any impacts that have already emerged as a result of earlier climate change. # Experimental Setup Future snow cover changes are simulated with the physics-based model Alpine3D (Lehning et al., 2006). It is applied to two regions: The canton of Graubünden and the Aare catchment. These domains are modeled with a Digital Elevation Model (DEM) with a resolution of 200 m × 200 m. This defines the simulation grid that has to be filled with land cover data and downscaled meteorological input data for each cell for the time period of interest at hourly resolution. The reference data set consists of automatic weather station data. All meteorological input parameters are spatially interpolated to the simulation grid. The reference period comprises only thirteen years (1999–2012), because the number of available high elevation weather stations for earlier times is not sufficient to achieve unbiased distribution of the observations with elevation. The model uses projected temperature and precipitation changes for all greenhouse gas scenarios (A1B, A2, and RCP3PD) and CH2011 time periods (2035, 2060, and 2085). # Data Snow cover changes are projected to be relatively small in the near term (2035) (Figure 5.1 top), in particular at higher elevations above 2000 m asl. As shown by Bavay et al. (2013) the spread in projected snow cover for this period is greater between different climate model chains (Chapter 3) than between the reference period and the model chain exhibiting the most moderate change. In the 2085 period much larger changes with the potential to fundamentally transform the snow dominated alpine area become apparent (Figure 5.1 bottom). These changes include a shortening of the snow season by 5–9 weeks for the A1B scenario. This is roughly equivalent to an elevation shift of 400–800 m. The slight increase of winter precipitation and therefore snow fall projected in the CH2011 scenarios (with high associated uncertainty) can no longer compensate for the effect of increasing winter temperatures even at high elevations. In terms of Snow Water Equivalents (SWE), the projected reduction is up to two thirds toward the end of the century (2085). A continuous snow cover will be restricted to a shorter time period and/or to regions at increasingly high elevation. In Bern, for example, the number of days per year with at least 5 cm snow depth will decrease by 90% from now 20 days to only 2 days on average.42 years ago
- The forest area refers to all areas classified as forest according to NFI’s forest definition. The forest definition includes shrub forest. For each forest function (including no special forest function) identified in the survey of the forestry services, the size of the associated forest area is displayed. One forest region may fulfil several different forest functions and may thus contribute to the forest area for several forest functions. __Citation:__ > _Abegg, M.; Brändli, U.-B.; Cioldi, F.; Fischer, C.; Herold-Bonardi, A.; Huber M.; Keller, M.; Meile, R.; Rösler, E.; Speich, S.; Traub, B.; Vidondo, B. (2014). Fourth national forest inventory - result tables and maps on the Internet for the NFI 2009-2013 (NFI4b). [Published online 06.11.2014] Available from World Wide Web http://www.lfi.ch/resultate/ Birmensdorf, Swiss Federal Research Institute WSL. [doi:10.21258/1057112](https://doi.org/10.21258/1057112)_22 years ago
- Snow and air data was monitored at Gotschnagrat (LON: 46.859 LAT: 9.849) by an infrarot radiometer (Campbell SI-111) for snow temperature (°C), a snow height sensor (Lufft SHM-31) for snow height change (cm) and a temperature and humidity sensor (Campbell CS-215) for air temperature (°C) and relative humidity (%). No filter was applied to the sensors and the smapling frequency was 1 Hz.42 years ago
- Data from pulse-labelling experiment with 100-year old trees of a naturally dry pine forest exposed to a 15-year-long irrigation experiment. Canopies of 10 trees were labelled for 3 hours with 13CO2 and the fate of this label was traced for one year in stem and soil respiration and in microbial biomass around these trees. Data include (1) microclimatic data and soil respiration rates of the year following pulse labelling. (2) Temporal patterns of the 13C signal and 13C excess in soil respired CO2 and microbial biomass. (3) Spatial distribution of 13C signal in the soil.12 years ago
- To validate the critical crack length as implemented in the snow cover model SNOWPACK, PST experiments were conducted for three winter seasons (2015-2017) at two field site above Davos, Switzerland. This dataset contains manually observed snow profiles and stability tests. Furthermore, corresponding SNOWPACK simulations are included. These data were analyzed and results were published in Richter et al. (2019). Please refer to the Readme file for further details on the data. These data are the basis of the following publication: Richter, B., Schweizer, J., Rotach, M. W., and van Herwijnen, A.: Validating modeled critical crack length for crack propagation in the snow cover model SNOWPACK, The Cryosphere, 13, 3353–3366, https://doi.org/10.5194/tc-13-3353-2019, 2019.52 years ago
- In order to quantify effects of ozone on Swiss forest ozone flux calculations are needed. Currently 5 stations are operated to measure the ozone load on forests. These data form the basis for ozone flux calculations. The ozone flux calculation is carried out with the DO3SE model (Büker et al. 2012). This can then be used for epidemiological evaluations for the Swiss forest (Thomas et al. 2005, Braun et al. 2014, Braun et al. 2017, Braun et al. 2020, Braun et al. 2021, Braun et al. 2022).12 years ago
- Long-term data on precipitation and runoff are essential to draw firm conclusions about the behavior and trends of hydrological catchments that may be influenced by land-use and climate change. Here the longest continuous runoff records (1903 - 2015) from small catchments (less than 1 km2) in Switzerland (and possibly worldwide) are provided as a data set. The history of the hydrological monitoring in the Sperbel- and Rappengraben (Emmental) is summarized in Stähli et al., Environ Monit Assess (2011). The runoff stations operated safely for more than 90% of the summer months when most of the major flood events occurred. Nevertheless, the absolute values of peak runoff during the largest flood events are subject to considerable uncertainty (also discussed in Stähli et al., 2011). This treasure trove of data can be used in various ways, eg. for analysis of the generalized extreme value distributions of the two catchments, of the mechanisms governing the runoff behavior of small catchments, as well as for testing stochastic and deterministic models.12 years ago
- Meteorological measurements recorded in the Dischma valley from 2014-2016. In 2014 and 2015 we used 11 mobile weather stations from sensorscope to record meteorological parameter in the upper Dischma valley in the closer surroundings of the Gletschboden area. The meteorological stations are eqiupped with at least air temperature/humidity, wind velocity and wind direction sensors. Some stations are additionally equipped with precipitation, shortwave radiation and snow surface temperature sensors. Three transects were installed at different aspects and were equipped with air temperature/humidity and wind sensors. Transect 1 (stations 2-4) provides meteorological Information on an east-north-east facing slope at elevations ranging between 2100 m and 2500 m. Transect 2 (stations 5-7) provides meteorological Information on a south-west slope and transect 3 (stations 8-10) on a north-west slope. Station 1 is fully equipped with meteorological sensors (temperature/humidity, wind, IR, up and downwand shortwave radiation and precipitation). In 2016, mobile stations from sensorscope were replaced with six permanent meteorological stations. Meteorological stations 1-3 are equipped with an air temperature/humidity sensor, two wind speed sensors, a wind direction sensor and an incoming and outgoing shortwave radiation sensor. Stations 4 and 6 are equipped with an air temperature/humidity sensor and a wind speed/direction sensor. Station 5 is a equipped with an air temperature/humidity sensor, a wind speed/direction sensor, a snow surface temperature sensor, an incoming and outgoing shortwave radiation sensor and an incoming longwave radiation sensor.82 years ago
- This dataset includes the parallel application and the main results supporting the research article "Modeling snow saltation: the effect of grain size and interparticle cohesion" published at the Journal of Geophysical Research: Atmospheres. The code is a flow solver based on the Large Eddy Simulation (LES) technique coupled with a Lagrangian Stochastic Model (LSM). The interaction of snow particles with the bed is modeled with statistical and physically-based models for aerodynamic entrainment, rebound and splash, following the works of Groot Zwaaftink et al. (2014), Comola and Lehning (2017) and Sharma et al. (2018). This algorithm was also used by Sigmund et al. (2021) to model snow sublimation.22 years ago
- Data and scripts of publication: Madleina Gerecke, Oskar Hagen, Janine Bolliger, Anna M. Hersperger, Felix Kienast, Bronwyn Price, Loïc Pellissier (2019) Assessing potential landscape service trade-offs driven by urbanization in Switzerland. Palgrave communications. Contains land use projections for Switzerland and scripts and data for these projections as well as the calculation of landscape services. Data Folder: Contains sub-folder with the data necessary for this study (provided were no copyright issues, otherwise placeholders with descriptions), and folders where produced data may be stored Scripts Folder: Contains scripts organized into subfolders depending on their purpose Note: Some abbreviations within the scripts and data are derived from German words and not English.22 years ago
- ### Overview We present GROUNDEYE, a new model of radiative transfer over mountainous terrain, which considers for the first time the forward scattering properties of snow. Embedded in the surface process model Alpine3D, the new terrain radiation model GROUNDEYE receives interpolated real weather data with diffuse and direct broadband shortwave radiation for each pixel as well as a spatially variable plane albedo from the module SNOWPACK. ### Format The GROUNDEYE model is written in c++, as is the entire environment of Alpine3d. The input and output data sets are .xlsx or .txt format, pre- and postprocessing including the generation of all figures is in .R format. ### Structure In Data_Forward_Scattering.zip you will find all necessary data and model details to reproduce the results of the JGR publication "How forward-scattering snow and terrain change the Alpine radiation balance with application to solar panels" - __Model Input Data__ contains the meteorological and topographic input data sets, the BRDF, and preprocessing scripts. - __Model Code__ contains the full model Alpine3d including the radiative transfer module GROUNDEYE. - __Model Output Data__ contains the results of the simulation of terrain irradiance and irradiance of solar panels; hourly resolution, 1. Sptember 2017 - 31. August 2018. - __Measurements Solar Testsite__ contains information and measurements of the solar testsite at the Totalp near Davos, Switzerland. - __Postprocessing__ contains all R-Scripts used for the analysis and plotting of the corresponding data. In each of these folders you will find detailed information in the file 'About this Folder.txt'.12 years ago
- Additional references to the article: Linking solar and biomass resources to generate renewable en-ergy: can we find local complementarities in the agricultural setting? Gillianne Bowman, Thierry Huber, Vanessa Burg Energies, https://www.mdpi.com/1996-1073/16/3/1486 Today, the energy transition is underway to tackle the problems of climate change and energy sufficiency. For this transition to succeed, it is essential to use all available re-newable energy resources most efficiently. However, renewable energies often bring high volatility that needs to be balanced. One solution is to combine the use of different renewable sources to increase the overall energy output or reduce its environmental impact. Here, we estimate the agricultural solar and biomass resources at the local level in Switzerland, considering their spatial and temporal variability using Geographic In-formation Systems. We then identify the technologies that could allow synergies or complementarities. Overall, the technical agricultural resources potential is ~15 PJ/annus biogas yield from residual biomass and ~10 TWh/a electricity from solar installed on roofs (equivalent to ~36 PJ/a). Anaerobic digestion, combined heat & power plant, Raw manure separation, Biomethane upgrading, Power to X, Electrolysis, Chill generation and Pho-tovoltaic on biogas facilities could foster complementarity in the system if resources are pooled within the agricultural setting. Temporal complementarity at the farm scale can only lead to partial autarchy. The possible benefits from these complementarities should be better identified, particulary in looking looking at the economic viability of such systems.42 years ago
- Short videos showing scenarios of potential landscape development in a 4°C warmer climate for a Swiss mountain region and a region on the Swiss Plateau. The videos are in German or French with subtitles. The videos' key message is: Climate change will have an impact on the Swiss landscapes. However, according to the strategy chosen to adapt to climate change, society and politics will also have a strong influence on the future landscapes and the services they will provide. If no action is taken to adapt to climate change today, then society will have to react in a hurry at a later point in time. This can often result in resource-intensive technical solutions. Conversely, if society takes action in an anticipatory way already today, nature-based solutions can be implemented more successfully and humans can benefit more from the landscape services.. These short videos are teasers that should make the viewers curious to visit the panorama pictures (https://viergrad.envidat.ch/).42 years ago
- Simulated net primary productivity (NPP) anomalies (percent deviation) in 1961-2018 years relative to the 1961–1990 reference period for _Picea abies_ and _Fagus sylvatica_. NPP was simulated for the species' potential distribution range in Switzerland on a 1 × 1 km grid using 3-PG model. We first assimilated nearly 800 observation years from 271 permanent long-term forest monitoring plots across Switzerland, obtained between 1980 and 2017, into the 3-PG forest ecosystem model using Bayesian inference, reducing the bias of model predictions from. We then estimated the NPP anomalies by first simulating the growth of _P. abies_ and _F. sylvatica_ monocultures with the average climate observed during the 1961–1990 period, until the age of 40 years (spin-up). The stands were simulated starting as 2-year-old plantations with an initial density of 10,000 trees/ha. Thinning was performed at age 20 and 35 to reach a final density of ca. 1,000 trees/ha at age 40. We then simulated 30 years forced by monthly resolved climatic data from either the 1961–1990 (reference, according to MeteoSwiss) or the 1991–2018 period. We neglected the first 40 years of simulations due to high variation in productivity caused by early stage stand development. To study the impact of climate extremes on NPP, we focused on the deviation in NPP (expressed in percentage difference from the reference period) during the 30 year period (age 41–70).12 years ago
- The R script IRFnnhs.R, which efficiently estimates impulse response functions for environmental systems that are nonlinear, nonstationary, or heterogeneous, based on their input and output time series. Scripts and results for a series of benchmark tests are also provided, to accompany Kirchner, J.W., Impulse response functions for heterogeneous, nonstationary, and nonlinear systems, estimated by deconvolution and demixing of noisy time series, _Sensors_, 22(9), 3291, https://doi.org/10.3390/s22093291, 2022.32 years ago
- This dataset contains all data on which the following publication below is based. __Paper Citation:__ > Resch, M.C., Schütz, M., Graf, U., Wagenaar, R., van der Putten, W.H., Risch, A.C. 2019. Does topsoil removal in grassland restoration benefit both soil nematode and plant communities? Journal of Applied Ecology 56: 1782-1793. Please cite this paper together with the citation for the datafile. # Methods ## Study area and experimental settings The study was conducted in a nature reserve (Eigental: 47° 27’ to 47° 29’ N, 8° 37’ E, 461 to 507 m a.s.l.) that is located on the Swiss Central plateau close to Zurich airport (Canton Zurich, Switzerland). The mean annual temperature in this area ranges from 8.9 to 10.6 °C, mean annual precipitation from 910 to 1260 mm [10-year average (2007-2017); MeteoSchweiz, 2018]. The main soil types are calcaric to gleyic Cambisol and Gleysols. The reserve was established in 1967 to protect small remnants of oligotrophic semi-natural grasslands (roughly 12 ha). The plant community can be characterized as Molinion and Mesobromion (semi-wet to semi-dry), depending on the site-specific groundwater level and slope inclination (Delarze, Gonseth, Eggenberg, & Vust, 2015). These remnants represent species-rich islands in an otherwise intensively managed agricultural landscape. Semi-natural grasslands covered an area of 60,000 ha in the Canton Zurich in 1939, however, by 2005 only roughly 600 ha remained (Baudirektion Kanton Zürich, 2007). In 1990, the government of Canton Zurich decided to enlarge the nature reserve Eigental. The goal was to incorporate eleven patches of 20 ha adjacent intensively farmed land and transform these patches into semi-natural grasslands. The patches had a different agricultural history, ranging from permanent (no tillage for >50 years) to temporary grassland (as part of crop rotation; last tillage <5 years). On all freshly integrated patches fertilization was stopped in 1992 and from then on biomass was harvested three times a year and removed. After 5 years without noticeable effects on vegetation composition, the Nature Conservation Agency of Canton Zurich decided to increase the restoration efforts. In 1995, a large-scale experiment was initialized to evaluate if certain treatments can facilitate restoration within a reasonable timeframe of 5 to 10 years after treatment implementation. The three restoration treatments used were: i. “Harvest only”: Plots are being mowed two to three times a year and the biomass is removed. ii. “Topsoil”: Topsoil was removed to a depth of 10 to 20 cm, depending on the depth of the O and A horizon, in four randomly selected areas within each of the eleven patches in late autumn 1995. The size of each topsoil removal area depended on individual patch size and was between 2700 and 7000 m2. iii. “Topsoil+Propagules”: Propagules from target vegetation were added on half of the area where topsoil was removed, using fresh, seed-containing hay originating from a mixture of semi-dry to semi-wet species-rich grasslands of local provenance (within a radius of 7 km). Hay applications were conducted twice in 1995 and 1996. Repeated applications were chosen to account for the low quantity of available plant material per transfer, since area ratio between receptor and donor sites was roughly 1:1. In addition, hand-collected propagules from 15 selected target species of regional provenance (within a radius of 30 km) were equally applied in 1996 and 1997. “Topsoil” and “Topsoil+Propagules” plots are mowed once a year, and the biomass is removed. Mowing on these plots started five years after the treatment was implemented. Eleven permanent plots of 5 m x 5 m were randomly established in each treatment to monitor the vegetation development. The experiment was complemented with 11 control plots that represent the initial state of intensively managed grasslands, further referred to as “Initial”, and 11 control plots that represent the targeted state of donor sites for “Topsoil+Propagules”, further referred to as “Target”. Consequently, the experiment consists of 55 plots (5 treatments x 11 replicates). Management of intensively used grasslands includes mowing and fertilizing (manure) between two to five times a year, as well as different tillage regimes (no tillage for >50 years; last time of tillage <5 years). ## Nematode and plant sampling Soil nematodes were sampled in 2 m x 2 m plots, randomly established at least 2 m away from the vegetation plots. We collected eight soil cores with a 2.2 cm diameter soil core sampler (Giddings Machine Company, Windsor, CO, USA) to a depth of 12 cm (representing the majority of the plant rooting system) in each plot at the beginning of July 2017. The eight cores within each replicate plot were combined, gently homogenized, placed in coolers and transported to the laboratory of NIOO in Wageningen, the Netherlands, within one week. Free-living nematodes were extracted from 200 g of fresh soil using Oostenbrink elutriator (Oostenbrink, 1960) and concentrated, resulting in 6 mL nematode solution. The nematode solution was subdivided into three subsamples, two for morphological identification and quantification, and one for molecular work (not used in this study). For morphological identification and quantification, nematodes were heat-killed at 90 °C and fixed in 4 % formaldehyde solution (final volume 10 mL per subsample). All nematodes in 1 mL of formaldehyde solution were counted, and a minimum of 150 individuals per 1 mL sample (or all if less nematodes were present) were identified to family level using Bongers (1988). We then extrapolated the numbers of each nematode taxa identified to the entire sample and expressed them per 100 g dry soil for further analyses. We calculated number of nematode taxa and Shannon diversity and assessed nematode community composition. In addition, we classified the nematode taxa into feeding types (herbivores, bacterivores, fungivores, omni-carnivores), structural and functional guilds (Table S4). Structural guilds assign nematode taxa according to life-history traits into five colonizer-persister (C-P) classes, ranging from one (early colonizers of new resources) to five (persisters in undisturbed habitats; Bongers 1990). C-P classes can be categorized as indicators for nutrient-enriched (C-P1), stressed (C-P2) and structured (C-P3 + C-P4 + C-P5) soil conditions (Ferris, Bongers, & de Goede, 2001). Functional guilds assign nematode taxa according to their C-P classification combined with their feeding habits (Ferris, Bongers, & de Goede, 2001). Based on the structural and functional guild classification we calculated five additional indices to assess soil nutrient status, disturbance and food web characteristics using NINJA (Sieriebriennikov, Ferris, & de Goede, 2014). 1) The Maturity index indicates the degree of different environmental perturbations (e.g., tillage, nutrient enrichment, pollution) and is used to monitor colonization and subsequent succession after disturbances (Bongers, 1990). 2) The ratio between the Plant Parasite (C-P of herbivorous nematodes only) to Maturity index is used to monitor the recovery of disturbed habitats incorporating information of life-history traits for all feeding types (Bongers, van der Meulen, & Korthals, 1997). 3) The Enrichment index indicates nutrient-enriched soils and agricultural management practices (Ferris, Bongers, & de Goede, 2001). 4) The Structure index provides information about the succession stage of the soil food web and therefore correlates with the degree of maturity of an ecosystem (Ferris, Bongers, & de Goede, 2001). 5) The Channel index provides information about the predominant decomposition pathways, where higher values stand for a higher proportion of energy transformed through the slow fungal decomposition channel (Ferris, Bongers, & de Goede, 2001). In addition, the Structure and Enrichment indices can be displayed in a biplot where nematode assemblages are plotted along a structure (x-axis) and enrichment (y-axis) trajectory (increasing index values). Each biplot quadrat reflects different levels of disturbance, soil nutrient pools and decomposition pathways (Ferris, Bongers, & de Goede, 2001). The plant surveys were conducted on the 25 m2 permanent plots in June 2017. Plant species cover was visually assessed according to the semi-quantitative cover-abundance scale of Braun-Blanquet (1964; nomenclature: Lauber & Wagner, 1996). We calculated number of species and Shannon diversity, and assessed plant community composition. We also counted the number of target species (all species recorded in the eleven target plots plus propagules of species applied by hand, resulting in a total of 143 species) and categorized plant species into species of concern based on their red list status in Switzerland as well as their protection status in Switzerland and the Canton Zurich (Moser, Gygax, Bäumler, Wyler, & Palese, 2002). Furthermore, we calculated indicator values for soil moisture and soil nutrients for each species according to Landolt et al. (2010). ## References Baudirektion Kanton Zürich (2007). 10 Jahre Naturschutz-Gesamtkonzept für den Kanton Zürich 1995-2005 – Stand der Umsetzung. Zürich: Baudirektion Kanton Zürich. Bongers, T. (1988). De nematoden van Nederland. Utrecht: Stichting Uitgeverij Koninklijke Nederlandse Natuurhistorische Vereniging. Bongers, T. (1990). The maturity index: an ecological measure of environmental disturbance based on nematode species composition. Oecologia, 83, 14-19. doi:10.1007/BF00324627 Bongers, T., van der Meulen, H., & Korthals, G. (1997). Inverse relationship between the nematode maturity index and plant parasite index under enriched nutrient conditions. Applied Soil Ecology, 6, 195-199. doi:10.1016/S0929-1393(96)00136-9 Braun-Blanquet, J. (1964). Pflanzensoziologie, Grundzüge der Vegetationskunde (3rd ed.). Wien: Springer. Delarze, R., Gonseth, Y., Eggenberg, S., & Vust, M. (2015). Lebensräume der Schweiz: Ökologie - Gefährdung - Kennarten (3rd ed.). Bern: Ott. Ferris, H., Bongers, T., & de Goede, R.G.M. (2001). A framework for soil food web diagnostics: extension of the nematode faunal analysis concept. Applied Soil Ecology, 18, 13-29. doi:10.1016/S0929-1393(01)00152-4 Landolt, E., Bäumler, B., Erhardt, A., Hegg, O., Klötzli, F., Lämmler, W., … Wohlgemuth, T. (2010). Flora indicativa. Ecological indicator values and biological attributes of the Flora of Switzerland and the Alps (2nd ed.). Bern: Haupt. Lauber, K., & Wagner, G. (1996). Flora Helvetica. Flora der Schweiz. Bern: Haupt. MeteoSchweiz (2018). Klimabulletin Jahr 2017, Zürich: MeteoSchweiz. Moser, D., Gygax, A., Bäumler, B., Wyler, N., & Palese, R. (2002) Rote Liste der gefährteten Farn- und Blütenpflanzen der Schweiz. Bern: BUWAL. Oostenbrink, M. (1960). Estimating nematode populations by some selected methods. In N.J. Sasser & W.R. Jenkins (Eds.), Nematology (pp. 85-101). Chapel Hill: University of North Carolina Press. Sieriebriennikov, B., Ferris, H., & de Goede, R.G.M (2014). NINJA: An automated calculation system for nematode-based biological monitoring. European Journal of Soil Biology, 61, 90-93. doi:10.1016/j.ejsobi.2014.02.00462 years ago
- 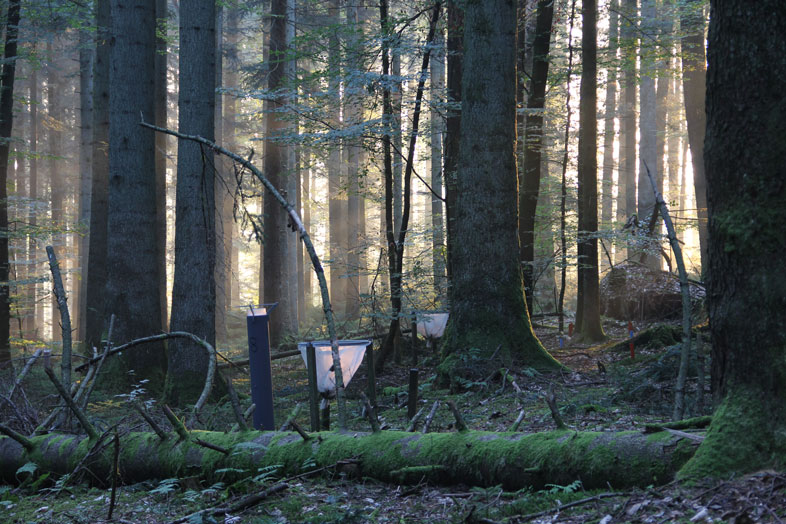 LWF Plot Vordemwald - Community: Vordemwald / canton AG - Date of installation: 18 August 1995 - Size of the plot: 2 ha - Altitude: 473-487 m - Mean slope: 14% - Geology (in German): Untergrund: Oligozän, Aquitanien, untere Süsswassermolasse, bunte Mergel - Oberfläche: Rissgrundmoräne - Soil types (WSL): Distric Gleysols - Woodland association after EK72: 46: Bazzanio-Abietetum - Main tree species: Abies alba - Management system: high forest - Silvicultural system: group selection - Top-height diameter (quadratic average diameter of the 100 thickest trees per ha): 53.9 cm - Number of trees BHD >= 12 cm (2011): 1084 - Maximum tree age: Abies alba 110 yr - Quercus sp. 190-210 yr More Information: https://www.wsl.ch/en/forest/forest-development-and-monitoring/long-term-forest-ecosystem-research-lwf/sites/vordemwald.html22 years ago
- Gas exchange was measured on control, irrigated and irrigation-stop trees at the irrigation experiment Pfynwald, during the years 2013, 2014, 2016-2020. The measurement campaigns served different purposes, resulting in a large dataset containing survey data, CO2 response curves of photosynthesis, light response curves of photosynthesis, and fluorescence measurements. Measurements were done with LiCor 6400 and LiCor 6800 instruments. Until 2016, measurements were done on excised branches or branches lower in the canopy. From 2016 onwards, measurements were done in the top of the canopy using fixed installed scaffolds. All metadata can be found in the attached documents.82 years ago
- Extreme events impact on the Swiss forest economy: the sawmill perspective Supplementary Information This survey aimed at answering three main questions: (i) What are the Swiss sawmills challenges and actions taken after a large storm/windthrow?, (ii) How do these challenges and actions vary across sawmill size and location?, and (iii) is adaptation from the sawmills to extreme events possible, with regards to wood type, products and required infrastructure? Informations supplémentaires Cette enquête visait à répondre à trois questions principales : (i) Quels sont les défis et les mesures prises par les scieries suisses après une grosse tempête ou un coup de vent ? (ii) Comment ces défis et ces mesures varient-ils selon la taille et l'emplacement de la scierie ? et (iii) l'adaptation des scieries aux événements extrêmes est-elle possible, en ce qui concerne le type de bois, les produits et l'infrastructure requise ? Ziel dieser Umfrage war die Beantwortung von drei Hauptfragen: (i) Welche s sind die Herausforderungen und Massnahmen der Schweizer Sägewerke nach einem grossen Sturm/Windwurf?, (ii) Wie unterscheiden sich diese Herausforderungen und Massnahmen je nach Grösse und Standort des Sägewerks? und (iii) Ist eine Anpassung der Sägewerke an Extremereignisse möglich, in Bezug auf Holzart, Produkte und erforderliche Infrastruktur?12 years ago
- The present dataset is the summary of each planning intention (name, type, development pattern, land use, and link with governance and supra regionel conditions), the explanation of interest, and the mapping from plan.12 years ago
- This data set includes material and results described in the related research article: Bergfeld, B., van Herwijnen, A., Reuter, B., Bobillier, G., Dual, J., and Schweizer, J.: Dynamic crack propagation in weak snowpack layers: Insights from high-resolution, high-speed photography, The Cryosphere Discuss. [preprint], https://doi.org/10.5194/tc-2020-360, in review, 2021. # Context: In order to study crack propagation in weak snowpack layers in great detail, we recorded Propagation Saw Test (PST) experiments using a high-speed camera and applied digital image correlation (DIC) to derive displacement and strain fields in the slab, weak layer, and substrate. We demonstrated the versatility and accuracy of the DIC method by showing measurements from three PST experiments, resulting in slab fracture, crack arrest and full propagation in the related publication. # Content: - Supplementary material for related publication - Ilustrative videos showing crack propagation - High-speed recordings of the Experiments (the raw .cine files are available upon request) Processed Data containing: - displacement, velocity and acceleration fields for the three PSTs - speed and touchdown dataset52 years ago
- Ips typographus was reared in climate chambers at constant temperatures of 12, 15, 20, 25, 30 and 33°C. Developmental times from egg to teneral beetle stages and daily oviposition of females from preoviposition phase to their death were recorded. From these data life tables were computed and the data were used for modelling.12 years ago
- The present dataset is part of the published scientific paper Grădinaru, S. R., & Hersperger, A. M. (2019). Green infrastructure in strategic spatial plans: Evidence from European urban regions. Urban forestry & urban greening, 40, 17-28. The goal of this research was to conduct a comparative analysis of the integration of green infrastructure concept in strategic spatial plans of European Urban regions. Specifically, the paper has the following objectivs: 1) which principles of GI planning are followed in strategic plans of urban regions? 2) can we identify different approaches to GI integration into strategic planning?. The study focues on a sample consisting of 14 case studies spanning 11 countries. We retrieved the strategic plans from the websites of the planning authorities. The list of the reviewed planning documents can be found in Appendix A of the paper. A protocol was developed to perform the content analysis of the strategic plans and gather the data. The detailed list of protocol items can be found in Appendix B of the paper. The planning documents were read in order to address the protocol items. The answer to the protocol items in each of the first two categories (items 1–11) was documented as text, while the answer for the third category, namely items addressing the planning principles (items 12–36), was coded according to Table 1 of the article. As a result, we provide the folowing outputs: • GI_Dataset_1_Items_1-12.xlsx – available on request o Results of the coding on general aspects regarding the strategic plans of urban regions as well as extracts from each plan to justify the coding option – this data was derived from the coding procedure coresponding to items from 1 to 12 of the protocol. The data was discussed qualitativly in the research paper. • GI_Dataset_2_Items_12-36.csv – freely available o Results of the coding on principles of GI planning followed in strategic plans of urban regions– this data was derived from the coding procedure coresponding to items from 12 to 36 of the protocol. The data served as input for the classifications performed through hierarchical cluster analysis. This data is a detailed version of Appendix C in the paper.22 years ago
- The data was generated during a landscape experiment performed on 69 plots in Sihlwald forest between 2016 and 2019. Branch bundles of different sizes consisting of beech branches were exposed in the forest for one year to be colonized by saproxylic beetles and later reared for one year in emergence traps. All beetles emerging from the branches were collected. Overall 244 branch bundles are included and we found 66 beetles species (23511 individuals) of which 43 were classified as saproxylic (20873 individuals). #### Species data (2 tables) Two community matrices (including abundance): one for saproxylic beetles and one for all beetles. Beetles were classfied as saproxylic following an extended list of the list reported in Schmidl & Bussler (2004). #### Model data (1 table) *Response variables* Species richness and abundance of (saproxylic) beetles. *Branch bundles* Branch bundles consisted of 1, 3, 6 or 12 branches and each bundle size was installed at each of the 69 plots. The bundles consisted of standardized freshly cut beech branches (Fagus sylvatica) with a length of 80 cm and a diameter between 3 and 6 cm. Total surface and volume of each bundle is reported. *Tree on which the bundle was installed* Information on the tree to which the bundles were attached (tree species, dbh, distance and azimut from the plot center). *Temperature and light availability* Temperature (plot level) and light availability (bundle level) were calculated. *Deadwood availability in the landscape* Based on a map of lying dead wood, dead wood amount and isolation were calculated for concentric circles with a radius ranging from 20 to 200 m (in 10 m steps) around each branch bundle. #### Variable descriptions (1 table)42 years ago
- Number of stems of dead trees and shrubs (standing and lying) starting at 12 cm dbh. __Citation:__ > _Abegg, M.; Brändli, U.-B.; Cioldi, F.; Fischer, C.; Herold-Bonardi, A.; Huber M.; Keller, M.; Meile, R.; Rösler, E.; Speich, S.; Traub, B.; Vidondo, B. (2014). Fourth national forest inventory - result tables and maps on the Internet for the NFI 2009-2013 (NFI4b). [Published online 06.11.2014] Available from World Wide Web http://www.lfi.ch/resultate/ Birmensdorf, Swiss Federal Research Institute WSL. [doi:10.21258/1057112](https://doi.org/10.21258/1057112)_32 years ago
- In fall 2019, a new set of climate change scenarios has been released for Switzerland, the CH2018 dataset (www.climate-scenarios.ch). The data are provided at daily resolution. We produced from the CH2018 dataset a new set of climate change scenarios temporally downscaled at hourly resolution. In addition, we extended this dataset integrating the meteorological stations from the Inter-Cantonal Measurement and Information System (IMIS) network, an alpine network of automatic meteorological stations operated by the WSL Institute for Snow and Avalanche Research SLF. The extension to the IMIS network is obtained using a Quantile Mapping approach in order to perform a spatial transfer of the CH2018 scenarios from the location of the MeteoSwiss stations to the location of the IMIS stations. The temporal downscaling is performed using an enhanced Delta-Change approach. This approach is based on objective criteria for assessing the quality of the determined delta and downscaled time series. In addition, this method also fixes a flaw of common quantile mapping methods (such as used in the CH2018 dataset for spatial downscaling) related to the decrease of correlation between different variables. The idea behind the delta change approach is to take the main seasonal signal (and mean) from climate change scenarios at daily resolution and to map it to a historical time series at hourly resolution in order to modify the historical time series. The obtained time series exhibit the same seasonal signal as the original climate change time series, while it keeps the sub-daily cycle from the historical time series. The applied methods (Quantile Mapping and Delta-Change) have limitations in correctly representing statistically extreme events and changes in the frequency of discontinuous events such as precipitation. In addition, the sub-daily cycle in the data is inherited from the historical time series, so there is no information of the climate change signal in this sub-daily cycle. A careful reading of the paper accompanying the dataset is necessary to understand the limitations and scope of application of this new dataset. This material is distributed under CC BY 4.0 license (https://creativecommons.org/licenses/by/4.0/legalcode).12 years ago
- This report was prepared as one of the synthesis report chapters of the Hydro-CH2018 project of the Federal Office for the Environment (FOEN). An important feature of snow cover is the fact that its volume and duration is subject to large year-to-year fluctuations. As frozen precipitation, snow cover is nothing other than a natural water reservoir that delays precipitation to runoff and is thus of outstanding importance for the seasonal water balance in Switzerland. Over a whole year, approximately 40% (22 km3) of the annual runoff currently comes from snow melting and only 1% from glacier melting. Typically, the snow cover in the Alpine region builds up over the autumn and winter months, reaches its maximum between February and May, depending on the altitude, and dominates the runoff processes during melting in the following spring and summer months. Due to the great dependence on minus temperatures and precipitation, the snow cover reacts sensitively to temperatures above 0° Celsius and more or less precipitation. Due to climate change and the associated warming, the proportion of precipitation that falls as snow decreases measurably. In addition to this reduction in snowfall, the warmer temperatures also cause the snow cover to melt more quickly. The decline in snowfall has so far mainly affected lower altitudes, where winter temperatures often reach positive levels. As climate change progresses, this trend is likely to continue and above all affect higher zones. Even at higher altitudes, the snow cover will then start later, melt away earlier and is increasingly no longer permanently present. This development will also have an effect on the water bodies. Today nival regimes, i.e. regimes shaped by snow, are shifting towards pluvial regimes, i.e. regimes dominated by rain. Overall, winter runoff increases, summer runoff decreases. By the end of the century, the proportion of runoff from snowmelt will decrease throughout Switzerland, albeit to a lesser extent than the proportion from glacier melt.22 years ago
- Continuous measurement of soil water content at 10 and 80 cm depth (3 replications) with 10-HS soil moisture probes (Decagon Incorporation, Pullman, WA, USA). ### Purpose: ### Monitoring of the soil water matrix potential ### Paper Citation: ### * Dobbertin, M.; Eilmann, B.; Bleuler, P.; Giuggiola, A.; Graf Pannatier, E.; Landolt, W.; Schleppi, P.; Rigling, A., 2010: Effect of irrigation on needle morphology, shoot and stem growth in a drought-exposed Pinus sylvestris forest. Tree Physiology, 30, 3: 346-360. [doi: 10.1093/treephys/tpp123](http://doi.org/10.1093/treephys/tpp123)12 years ago
- Datasets and R scripts ~~~~~Datasets Dataset_S1.csv: Distribution of species diversity in plant and vertebrate clades. Total clade level diversity and species diversity in tropical moist forests (TMF) across the Neotropics, Indomalaya and Afrotropics. Pantropical clades are found in all three TMF regions with at least one-third of the clades’ total diversity spread throughout these regions. Pantropical diversity disparity (PDD) clades show lower diversity in TMF in the Afrotropics than in the Neotropics and Indomalaya. Dataset_S2.csv: Environmental and species richness data across 110 km x 110 km grid cells in Neotropical, Indomalayan and Afrotropical moist forest sites. Variables include x and y coordinates in the Behrmann equal area coordinate reference system, potential evapotranspiration (PET), mean annual temperature (MAT), mean annual precipitation (MAP), amphibian, mammal, bird and squamate reptile species richness and biogeographic region, as well as the first two principal components of a principal component analysis on PET, MAT and MAP (PC1, PC2). Dataset_S3.csv: Global reconstructed paleo-temperature estimates and spatial coordinates across 200 million years at 170,000 year intervals at 2 degree spatial resolution. Dataset_S4.csv: Gen3sis model parameters and biodiversity summary statistics. Summary statistics include the number of extant species, the number of extinct species, the total number of species, the number of species within the tropical moist forest biome boundaries in the Neotropics, the Afrotropics and Indomalaya, the pantropical index, and the pantropical disparity index, as well as the running time-step and diversity of unfinished simulations. Dataset_S5.csv: Net relatedness index (NRI) values for vertebrate clades showing an observed disparity in pantropical diversity in the Neotropical, Indomalayan and Afrotropical moist forest regions and associated P-values. Positive values indicate phylogenetic clustering, whereas negative values indicate phylogenetic overdispersion. ~~~~~Scripts Script_1 - GLS.R. R script to replicate the linear modelling analyses. Script_2 - Gen3sis_config_template.R. R script to generate the configurations files to run the simulation experiment. Script_3 - Gen3sis_config_creator.R. R script to generate the configurations files to run the simulation experiment.82 years ago
- Supplementary material for the publication " Agricultural biogas plants as a hub to foster circular economy and bioenergy: An assessment using material substance and energy flow analysis" Burg, V., b, Rolli, C., Schnorf, V., Scharfy, D., Anspach, V., Bowman, G. Today's agro-food system is typically based on linear fluxes (e.g. mineral fertilizers importation), when a circular approach should be privileged. The production of biogas as a renewable energy source and digestate, used as an organic fertilizer, is essential for the circular economy in the agricultural sector. This study investigates the current utilization of wet biomass in agricultural anaerobic digestion plants in Switzerland in terms of mass, nutrients, and energy flows, to see how biomass use contributes to circular economy and climate change mitigation through the substitution effect of mineral fertilizers and fossil fuels. We quantify the system and its benefits in details and examine future developments of agricultural biogas plants using different scenarios. Our results demonstrate that agricultural anaerobic digestion could be largely increased, as it could provide ten times more biogas by 2050, while saving significant amounts of mineral fertilizer and GHG emissions.12 years ago
- Cloud base height (m) and vertical visibility (m) were measured with the VAISALA Ceilometer CL31 in Klosters (LON: 9.880413, LAT: 46.869019). The CL31 is an instrument with constant reliability for all weather conditions and simultaneous detection of three cloud layers in heights up to 7.6 km.12 years ago
- There were 2 cores taken at 1.3 m height from each of 10 trees outside the LWF plot ### Purpose: ### influence of drought and nutrient availabiliy on tree growth ### Paper Citation: ### * Lévesque, M., Walthert, L., Weber, P., 2016. Soil nutrients influence growth response of temperate tree species to drought. J. Ecol. 104, 377-387.12 years ago
-  This research site is located on the southern slope of the Lägern, which forms the eastern most part of the Jura mountains, within a managed mixed deciduous forest. The forest is highly diverse, dominated by beech, but also including ash, maple, spruce and fir trees. Eddy covariance flux measurements were started in April 2004. The site was part of the international CarboEurope IP network and currently part of the following national networks: * National Air Pollution Monitoring Network ([NABEL](https://www.empa.ch/web/s503/nabel)) * [TreeNet](https://treenet.info/switzerland/laegeren): The biological drought and growth indicator network * Long-term Forest Ecosystem Research ([LWF](https://www.wsl.ch/en/forest/forest-development-and-monitoring/long-term-forest-ecosystem-research-lwf/sites/laegeren.html)) * [Swiss FluxNet](https://www.swissfluxnet.ethz.ch/index.php/sites/ch-lae-laegeren/site-info-ch-lae/) The site measurements are jointly run by the Swiss Federal Laboratories for Materials Science and Technology ([EMPA](https://www.empa.ch)), the groups [Grassland Sciences](https://www.gl.ethz.ch) and [Land-Climate Dynamics](https://iac.ethz.ch/group/land-climate-dynamics.html) from the Swiss Federal Institute of Technology Zurich, the unit [Soil Science & Biogeochemistry](https://www.geo.uzh.ch/en/units/2b.html) from the University of Zurich, and the Swiss Federal Research Institute ([WSL](https://www.wsl.ch)). LWF Plot Lägeren - Community: Wettingen / canton AG - Date of installation: 1.05.2012 - Size of the plot: 1.34 ha - Altitude: 643 - 718 m - Mean slope: 37 % - Geology (in German): Kettenjura; Jura: Malm, Molassehangschutt - Soil types (WSL) : calcareous brown soil, chromic luvisol, mixed rendzina - Woodland association after Ellenberg and Klötzli's classification (1972): Galio odoratio-Fagetum typicum bis - Pulmonario-Fagetum typicum - Main tree species: fagus sylvatica - Management system: high forest - Silvicultural system: forest reserve - Top-height diameter (quadratic average diameter of the 100 thickest trees per ha): 72.18 cm - Number of trees BHD >= 12 cm (2011): 503 - Maximum tree age: picea abies: 120-170 years, fagus sylvatica: ca. 150 years12 years ago
- Earth’s snow cover is very dynamic on diurnal time scales. The changes to the snow structure during this metamorphism have wide ranging impacts such as on avalanche formation and on the capacity of surface snow to exchange trace gases with the atmosphere. Here, we investigate the influence of dry metamorphism, which involves fluxes of water vapor, on the chemical reactivity of bromide in the snow. For this, the heterogeneous reactive loss of ozone at a concentration of 5-6E12 molecules cm-3 is investigated in artificial, shock-frozen snow samples doped with 6.2 uM sodium bromide and with varying metamorphism history. The oxidation of bromide in snow is one reaction initiating polar bromine releases and ozone depletions.72 years ago
- This dataset was used to analyze the inter-observer error (i.e. pseudoturnover) in vegetation surveys for the publication Boch S, Küchler H, Küchler M, Bedolla A, Ecker KT, Graf UH, Moser T, Holderegger R, Bergamini A (2022) Observer-driven pseudoturnover in vegetation monitoring is context dependent but does not affect ecological inference. Applied Vegetation Science. In the framework of the project "Monitoring the effectiveness of habitat conservation in Switzerland", we double-surveyed a total of 224 plots that were marked once in the field and then sampled by two observers independently on the same day. Both observers conducted full vegetation surveys, recording all vascular plant species, their cover, and additional plot information. We then calculated mean ecological indicator values and pseudoturnover. The excel file contains two sheets: 1) Raw species lists of the 224 plots conducted by two different observers. Woody species are distinguished in three layers: H (herb layer; woody species <0.5 m in height), S (shrub layer; woody species 0.5–3 m in height) and T (tree layer; woody species >3 m in height). "cf." indicates uncertain identification, "aggr." indicates that the plant was identified only to the aggregate level. Cover was estimated for each species using a modified Braun-Blanquet scale (r ≙ <0.1%, + ≙ 0.1% to <1%, 1 ≙ 1% to <5%, 2 ≙ 5% to <25%, 3 ≙ 25% to <50%, 4 ≙ 50% to <75%, 5 ≙ 75% to <100%). 2) File used for the linear mixed effects model.12 years ago
- Continuous sap flow measurements with Granier-needles to investigate carbon balance and water relations of trees ### Purpose: ### Assessment of water cycle processes12 years ago
- The dataset includes leaf spectroscopy, leaf traits and genetic data for oriental and european beech trees at two mature forest sites (Allenwiller in France and Wäldi in Switzerland) sampled in summer 2021 and 2022 for top and bottom of canopy leaves.42 years ago
- # Important This EnviDat entry is outdated. The most recent, usable version of the data can be found under the new EnviDat entry "Long-term afforestation experiment at the Alpine treeline site Stillberg, Switzerland." The entry can be found under this link and with this DOI 10.16904/envidat.397.32 years ago
- Habitat shift caused by human impact on vegetation structure poses a great threat to species which are special- ized on unique habitats. Single layered beech forests, the main foraging habitat of Greater Mouse-eared Bats (My- otis myotis), are threatened by recent changes in forest structure. After this species suffered considerable popula- tion losses until the 1970s, their roosts in buildings are strictly protected. However, some populations are still de- clining. Thus, the spatial identification of suitable foraging habitat would be essential to ensure conservation pol- icy. The aim of this study was (a) to verify the relevance of forest structural variables for the activity of M. myotis and (b) to evaluate the potential of LiDAR (Light Detection and Ranging) in predicting suitable foraging habitat of the species. We systematically sampled bat activity in forests close to 18 maternity roosts in Switzerland and applied a generalized linear mixed model (GLMM) to fit the activity data to forest structure variables recorded in the field and derived from LiDAR. We found that suitable forest foraging habitat is defined by single layered for- est, dense canopy, no shrub layer and a free flight space. Most importantly, this key foraging habitat can be well predicted by airborne LiDAR data. This allows for the first time to create nationwide prediction maps of potential foraging habitats of this species to inform conservation management. This method has a special significance for endangered species with large spatial use, whose key resources are hard to identify and widely distributed across the landscape.32 years ago
- This dataset contains the data acquired during the expedition to Princess Elisabeth Antarctica Station in December 2016 and January 2017. The dataset consits of meterorological data, drifting snow mass flux data, SnowMicroPen data and Terrestrial Laser Scanning data. Please refer to the README for more information about the data. This dataset is the basis of the following publication: Sommer, C. G., Wever, N., Fierz, C., and Lehning, M.: Wind-packing of snow in Antarctica, The Cryosphere Discuss., https://doi.org/10.5194/tc-2018-36, in review, 2018.22 years ago
- Wood volume of the trunk without bark or branches at least 7 cm in diameter (limit for coarse wool) of all trees and shrubs starting at 12 cm dbh, based on the stem-form function according to Kaufmann (2001). The definition of the assortment is based on the 2010 edition of the Trading Practices (Handelsgebräuchen Ausgabe 2010). __Citation:__ > _Abegg, M.; Brändli, U.-B.; Cioldi, F.; Fischer, C.; Herold-Bonardi, A.; Huber M.; Keller, M.; Meile, R.; Rösler, E.; Speich, S.; Traub, B.; Vidondo, B. (2014). Fourth national forest inventory - result tables and maps on the Internet for the NFI 2009-2013 (NFI4b). [Published online 06.11.2014] Available from World Wide Web http://www.lfi.ch/resultate/ Birmensdorf, Swiss Federal Research Institute WSL. [doi:10.21258/1057112](https://doi.org/10.21258/1057112)_12 years ago
- This is the source code for computing the seasonal fractional snow-covered area. It is written in Fortran 90. The code reads snow depth (HS) and snow water equivalent (SWE) data from the provided example file HS_SWE.txt and writes the computed fractional snow-covered area (fSCA) to a file fSCA.txt. The current version can be found in the WSL/SLF Gitlab repository: https://gitlabext.wsl.ch/snow-models/fractional-snow-covered-area12 years ago
- High quality meteorological data are needed for long-term forest ecosystem research, particularly in the light of global change. The long-term data series published here comprises almost 20 years of measurements for two meteorological stations in Isone in Switzerland where one station is located within a natural broad-leaved forest stand (ISB) with European beech (_Fagus sylvatica_; 70-100 yrs) as dominant tree species. A second station is situated in the very vicinity outside of the forest (field station, ISF). The meteorological time series are presented in hourly time resolution of air temperature, relative humidity, precipitation, photosynthetically active radiation (PAR) and wind speed. Isone is part of the Long-term Forest Ecosystem Research Programme (LWF) established and maintained by the Swiss Federal Research Institute WSL.72 years ago
- Please cite this paper together with the citation for the datafile. Resch, M. C., Schütz, M., Buchmann, N., Frey, B., Graf, U., van der Putten, W. H., Zimmermann, S., Risch, A. C. 2021. Evaluating long-term success in grassland restoration – an ecosystem multifunctionality approach. Ecological Applications 31, e02271. ### Study area The study was conducted in the Canton of Zurich, Switzerland, in and around two nature reserves Eigental and Altläufe der Glatt (47°27’ to 47°29’ N, 8°37’ to 8°32’ E, 417 to 572 m a.s.l.). All studied grasslands were located with a radius of approximately 4 km. Average monthly temperatures range from 0.7 ± 2.0 °C (January) to 19.0 ± 1.5 °C (July), and monthly precipitation range from 60 ± 42 mm (January) to 118 ± 46 mm (July [maxima]; 1989-2017; MeteoSchweiz 2018). In our study, we focused on semi-dry and semi-wet oligo- to mesotrophic grasslands characterized by high plant species richness and groundwater fluctuations throughout the year (Delarze et al. 2015, see also Resch et al. 2019). ### Experimental design and sampling A large-scale restoration experiment to expand and reconnect isolated remnants of species-rich grasslands was initiated in the nature reserve Eigental in 1990. Twenty hectares of adjacent intensive grasslands were chosen for restoration. In 1995, three restoration methods of increasing intervention intensities were implemented. The goal of all three methods was to lower the availability of soil nutrients and hence, facilitate ecosystem development towards the targeted nutrient-poor grasslands. These methods were: Harvest only (hay harvest twice a year), Topsoil (removal of the nutrient-rich topsoil), and Topsoil+Propagules (topsoil removal combined with the application of hay from target vegetation). Plant biomass harvest (once a year in late summer/early autumn) commenced in Topsoil and Topsoil+Propagules five years after the soils were removed and is still ongoing today. We measured restoration success by comparing the three restoration methods with intensively managed (Initial) and semi-natural grasslands (Target) 22 years after restoration. Initial grassland sites share the same agricultural history as the restored sites: mowing and subsequent fertilizing (manure) up to five times a year, as well as different tillage regimes (Resch et al. 2019). Target sites were the sites from which hay for seeding the Topsoil+Propagules sites was collected. Soil conditions (i.e., soil types, soil texture) were comparable to those found in the restored grasslands (Resch et al. 2019). Additionally, Target sites were selected to represent a variety of semi-natural grasslands, including semi-dry to semi-wet conditions. In Target grasslands, biomass is harvested once a year in late summer or early autumn. Eleven 5 m x 5 m (25 m2) plots were randomly established in each of the five treatments (in total 55 plots; for a detailed map see Neff et al. 2020). An additional 2 m x 2 m (4 m2) subplot was randomly established at least 2 m away from each 25 m2 plot for destructive sampling. Data sampling took place between June and September 2017. Vegetation properties All plant species were identified within the 25 m2 plots (nomenclature: Lauber and Wagner 1996) in mid-June 2017 (in total 250 species). Vegetation structure and plant biomass were assessed diagonally on a transect of 2 m x 10 cm within the 25 m2 plot in early July 2017. We measured the maximum and mean height of the vegetation at the start, middle and end of the transect and calculated the standard deviation of these measures to describe vegetation structural heterogeneity (Schuldt et al. 2019). Thereafter, biomass was clipped on the entire transect to 1 cm height, sorted into five functional groups (graminoids, forbs, legumes, litter, and woody species), dried at 60 °C for 48 h, and weighed (Meyer et al. 2015). ### Aboveground arthropods Aboveground arthropods were sampled at two locations in each 25 m2 plot in early July 2017 (see also Neff et al. 2020). Briefly, two cylindrical baskets (50 cm diameter, 67 cm height; woven fabric) were thrown simultaneously from outside the plot into two opposite corners. A closable mosquito mesh sleeve was mounted to the top of the baskets and an integrated metal ring at the bottom was fixed to the ground with metal stakes to assure that insects could not escape. A suction sampler (Vortis, Burkhard Manufacturing Co. Ltd., Hertfordshire, England) was then inserted into one of the baskets through the opening of the sleeve and the plot was “vacuumed" twice for 105 seconds with a 30 seconds break. The collected animals were immediately transferred into 70% ethanol. Arthropods were sorted and assigned to 23 taxonomic groups. Holometabolic larvae were lumped into one category while hemimetabolic larvae were grouped separately from adults in the respective taxonomic rank. We used mean values of individuals per plot for total abundance. Aboveground arthropod richness was defined by the number of different taxa to lowest taxonomic level (in total 23 taxa). All taxa were assigned to one of five trophic levels: 1) primary producers, 2) primary consumers, 3) secondary consumers, 4) tertiary consumers, and 5) quaternary consumers. ### Belowground fauna Sampling of all belowground fauna took place in mid-July 2017. Earthworms were sampled in two 30 cm x 30 cm x 20 cm soil monoliths at two opposite corners of the 25 m2 plot (opposite to aboveground arthropod sampling). The excavated soil monolith was broken by hand, all earthworms collected and immediately transferred in a 4% formaldehyde solution. Thereafter, earthworm individuals were identified to species level (in total 10 taxa; Christian and Zicsi 1999) and species assigned to three functional groups (Bouché 1977). To assess soil arthropod communities, we randomly collected one undisturbed soil core (5 cm diameter, 12 cm depth) in each 4 m2 subplot with a slide hammer corer lined with a plastic sleeve (AMS Samplers, American Falls, Idaho, USA). Soil arthropods were extracted using Berlese-Tullgren funnels (3 mm mesh), starting the day of sampling and lasting 14 days. Individuals were stored in 70% ethanol. Soil arthropods were assigned to 41 taxonomic groups and 4 feeding types. Holometabolic and hemimetabolic larvae were treated as previously described for aboveground arthropods. Belowground arthropod richness refers to the 41 taxonomic groups. For soil nematode sampling, we randomly collected eight soil cores of 2.2 cm diameter (Giddings Machine Company, Windsor, CO, USA) within each 4 m2 subplot to a depth of 12 cm. The eight cores were combined, gently homogenized, placed in coolers, kept at 4 °C and transported to the laboratory at NIOO in Wageningen (NL) within one week after collection. Free-living nematodes were extracted from 200 g of fresh soil using Oostenbrink elutriator (Oostenbrink 1960) and prepared for morphological identification and quantification as described by Resch et al. (2019). Nematodes were identified to family level (39 taxa) according to Bongers (1988), assigned to 17 functional groups, 5 feeding types and 5 colonizer-persister (C-P) classes (Yeates et al. 1993, Bongers 1990, Resch et al. 2019). We randomly collected two more soil cores (2.2 cm diameter x 12 cm depth) within each 4 m2 subplot to determine soil microbial communities. Again, the soil cores were combined, homogenized, placed in coolers and transported to the laboratory at WSL in Birmensdorf (Switzerland) where the metagenomic DNA was extracted from 8 g sieved soil (2 mm) using the DNeasy PowerMax Soil Kit (Quiagen, Hilden, NRW, GER) according to the manufacturer`s instructions. PCR amplification of the V3-V4 region of the prokaryotic small-subunit (16S) and the ribosomal internal transcribed spacer region (ITS2) of eukaryotes was performed with 1 ng of template DNA utilizing PCR primers and conditions as previously described (Frey et al., 2016). PCRs were run in triplicates and pooled. The pooled amplicons were sent to the Genome Quebec Innovation Centre (Montreal, QC, Canada) for barcoding using the Fluidigm Access Array technology (Fluidigm) and paired-end sequencing on the Illumina MiSeq v3 platform (Illumina Inc., San Diego, CA, USA). Quality filtering, clustering into operational taxonomic units (OTUs) and taxonomic assignment were performed as described by Frey et al. (2016) and Adamczyk et al. (2019). We used a customised pipeline largely based on UPARSE (Edgar 2013) implemented in USEARCH v. 9.2 (Edgar 2010). After discarding singletons of dereplicated sequences, clustering into OTUs with 97% sequence similarity was performed (Edgar 2013). Quality-filtered reads were mapped on the filtered set of centroid sequences. Taxonomic classification of prokaryotic and fungal sequences was conducted querying against most recent versions of SILVA (v.132, Quast et al. 2013) and UNITE (v.8, Nilsson et al. 2018). Only taxonomic assignments with confidence rankings equal or higher than 0.8 were accepted (assignments below 0.8 set to unclassified). Prokaryotic OTUs assigned to mitochondria or chloroplasts as well as eukaryotic OTUs assigned other than fungi were removed prior to data analysis. In addition, prokaryotic and fungal datasets were filtered to discard singletons and doubletons. Thereafter, OTU abundance matrices were rarefied to the lowest number of sequences per community, to normalize the total number of reads and achieve parity between samples (Prokaryota: 29,843 reads; Fungi: 26,690 reads). Finally, prokaryotic and fungal observed richness (number of OTUs) were estimated (Prokaryota: 14,010 OTUs; Fungi: 5,813 OTUs). For prokaryotes, we distinguished five and for fungi six functional types based on lowest taxonomic resolution (Nguyen et al. 2016, Tedersoo et al. 2014). Belowground taxon richness was defined by the total number of earthworm, arthropod, nematode, fungi, and prokaryote taxa assigned to lowest taxonomic level. Finally, all belowground taxa were assigned to the same five trophic levels as the aboveground arthropods. ### Soil chemical and physical properties, soil nitrogen mineralization We randomly collected three 5 cm diameter x 12 cm depth soil samples in each 4 m2 subplot with a slide hammer corer (AMS Samplers, American Falls, Idaho, USA), pooled them and then made two subsamples. One was field-fresh and stored at 3 °C until analysis, the other was dried for 48 h at 60 °C and passed through a 4 mm mesh. From the dried sample, we measured soil pH potentiometrically in 0.01 M CaCl2 (soil:solution ratio=1:2; 30 minutes equilibration time). Total and organic carbon content were measured on fine-ground samples (≤ 0.5 mm) by dry combustion using a CN analyzer NC 2500 (CE Instruments, Wigan, United Kingdom). Inorganic carbon of samples with a pH > 6.5 was removed with acid vapor prior to analysis of organic carbon (Walthert et al. 2010). We calculated total soil carbon (C) storage after correcting its content for soil depth, stone content and density of fine earth (see below). Exchangeable cations were determined on another 5 g dry soil sample with 50 mL unbuffered 1 M NH4Cl solution (soil:solution ratio=1:10, end-over-end shaker for 1.5 hours) and measured by an ICP-OES (Optima 7300 DV, Perkin-Elmer, Waltham, Massachusetts, USA). Thereafter, cation exchange capacity (CEC) was calculated as the sum of exchangeable cations and protons (and expressed as mmolc per 1 kg soil) and used to describe nutrient retention capacity in our plots. Concentrations of exchangeable protons were calculated as the difference between total and Al-induced exchangeable acidity as determined by the KCl-method (Thomas 1982). Ammonium (NH4+) and nitrate (NO3−) were extracted from a 20 g fresh subsample with 80 mL 1M KCl for 1.5 hours on an end-over-end shaker and filtered through ashless folded filter paper (DF 5895 150, ALBET LabScience, Hahnemühle FineArt GmbH, Dassel, Germany). NH4+ concentrations were determined colorimetrically by automated flow injection analysis (FIAS 300, Perkin-Elmer, Waltham, Massachusetts, USA). NO3− concentrations were measured colorimetrically according to Norman and Stucki (1981). Potential soil net nitrogen (N) mineralization was assessed during an 8-week incubation period under controlled moisture (60% of field capacity), temperature (20 °C) and light conditions (dark) in the laboratory. We weighed duplicate samples of fresh soil equivalent to 8 g dry soil (24 h at 104 °C) into 50 mL Falcon tubes. Soil samples were extracted for NH4+ and NO3− at the beginning and after eight weeks as described above. Soil net N mineralization was calculated as the difference between the inorganic nitrogen (NH4+ and NO3−) before and after the incubation (Hart et al. 1994), corrected for the total incubation time and represented per day values expressed as mg N kg-1 soil d-1. To assess soil physical properties, we randomly collected one undisturbed soil core per 4 m2 subplot (5 cm diameter, 12 cm depth) in a steel cylinder that fit into the slide hammer (AMS Samplers, American Falls, Idaho, USA). The cylinder was capped in the field to avoid disturbance. We then measured field capacity in the laboratory. For this purpose, the cylinder and soil therein were saturated in a water bath and drained on a sand/silt-bed with a suction corresponding to 60 cm hydrostatic head. The moist soil was dried at 105 °C to constant weight. Field capacity was calculated by dividing the mass of water by the total mass of wet soil contained at 60 cm hydrostatic head and used to describe water holding capacity. Thereafter, samples were passed through a 4 mm mesh. Fine-earth and skeleton fractions were weighed separately to assess bulk soil density (fine-earth plus skeleton), density of fine earth, and proportion of skeleton. Particle density was determined with the pycnometer method (Blake and Hartge 1986), and total porosity and proportion of fine pores were calculated (Danielson and Sutherland 1986). Clay, silt, and sand contents were quantified with the sediment method (Gee and Bauder 1986). Surface and soil temperature (12 cm depth, water-resistant digital pocket thermometer; IP65, H-B Instrument, Trappe, Pennsylvania, USA) as well as volumetric soil moisture content (12 cm depth, time domain reflectometry; Field-Scout TDR 300, Spectrum Technologies, Aurora, Illinois, USA) were measured at five random locations within the 4 m2 subplots every month from June to September. We calculated the standard deviation of each temperature and moisture measure over four months to describe seasonal variations. Slope inclination was determined at plot-level via GPS measurements (GPS 1200, Leica Geosystem, Heerbrugg, Switzerland) and categorized into slope gradient classes according to FAO standards (1990). Thickness of the topsoil horizon (equivalent to Ah or Aa horizon) was determined at one soil monolith (30 x 30 x 30 cm3) per 4 m2 subplot in cm and rounded to next integer. ### References Adamczyk, M., F. Hagedorn, S. Wipf, J. Donhauser, P. Vittoz, C. Rixen, A. Frossard, J. Theurillat, and B. Frey. 2019. The soil microbiome of GLORIA mountain summits in the Swiss Alps. Frontiers in Microbiology 10:1080-1101. Blake, G.R., and K. H. Hartge. 1986. Particle Density. Pages 377-382 in A. Klute, editor. Methods of soil analysis: Part 1—Physical and mineralogical methods. Soil Science Society of America (SSSA) Inc., Madison. Bongers, T. 1988. De nematoden van Nederland. Stichting Uitgeverij van de Koniklijke Nederlandse Natuurhistorische Verenigung (KNNV), Utrecht. Bongers, T. 1990. The maturity index: an ecological measure of environmental disturbance based on nematode species composition. Oecologia 83:14-19. Bouché, M. B. 1977. Strategies lombriciennes. Ecological Bulletins 25:122-132. Christian, E., and A. Zicsi. 1999. Ein synoptischer Bestimmungsschlüssel der Regenwürmer Österreichs (Oligochaeta: Lumbricidae). Die Bodenkultur 50:121-131. Danielson, R. E., and P. L. Sutherland. 1986. Porosity. Pages 443-461 in A. Klute, editor. Methods of soil analysis: Part 1—Physical and mineralogical methods. Soil Science Society of America (SSSA) Inc., Madison. Delarze, R., Y. Gonseth, S. Eggenberg, and M. Vust. 2015. Lebensräume der Schweiz: Ökologie ‐ Gefährdung ‐ Kennarten, Ott Verlag, Bern. Edgar, R. C. 2010. Search and clustering orders of magnitude faster than BLAST. Bioinformatics 26:2460–2461. Edgar, R. C. 2013. UPARSE: highly accurate OTU sequences from microbial amplicon reads. Nature Methods 10:996–998. FAO. 1990. Guidelines for soil description, third ed. Land and Water Development Division at the Food and Agriculture Organization of the United Nations (FAO), Rome. Frey, B., T. Rime, M. Phillips, B. Stierli, I. Hajdas, F. Widmer, and M. Hartmann. 2016. Microbial diversity in European alpine permafrost and active layers. FEMS Microbiology Ecology 92:fiw018. Gee, G.W., and J. W. Bauder. 1986. Particle-size analysis. Pages 383-411 in A. Klute, editor. Methods of soil analysis: Part 1—Physical and mineralogical methods. Soil Science Society of America (SSSA) Inc., Madison. Hart, S. C, J. M. Stark, E. A. Davidson, and M. K. Firestone. 1994. Nitrogen mineralization, immobilization, and nitrification. Pages 985-1016 in R. W. Weaver, S. Angle, P. Bottomley, D. Bezdicek, S. Smith, A. Tabatabai, and A. Wollum, editors. Methods of soil analysis: Part 2—Microbiological and biochemical properties. Soil Science Society of America (SSSA) Inc., Madison. Lauber, K., Wagner, G., 1996. Flora Helvetica. Flora der Schweiz. Haupt Verlag, Bern. MeteoSchweiz, 2018. Klimabulletin Jahr 2017. MeteoSchweiz, Zürich. Meyer, S. T., C. Koch, and W. W. Weisser. 2015. Towards a standardized rapid ecosystem function assessment (REFA). Trends in Ecology and Evolution 30:390-397. Neff, F., M. C. Resch, A. Marty, J. Rolley, M. Schütz, A. C. Risch, and M. M. Gossner. 2020. Long-term restoration success of insect herbivore communities in semi-natural grasslands – a functional approach. Ecological Applications 0:e02133 Nguyen, N.H., Z. W. Song, S. T. Bates, S. Branco, L. Tedersoo, J. Menke, J. S. Schilling, and P. G. Kennedy. 2016. FUNGuild: an open annotation tool for parsing fungal community datasets by ecological guild. Fungal Ecology 20:241–248. Nilsson, R. H., K.-H. Larsson, A. F. S. Taylor, J. Bengtsson-Palme, T. S. Jeppesen, D. Schigel, P. G. Kennedy, K. Picard, F. O. Glöckner, L. Tedersoo, I. Saar, U. Kõljalg, and K. Abarenkov. 2018. The UNITE database for molecular identification of fungi: handling dark taxa and parallel taxonomic classifications. Nucleic Acids Research 47:259–264. Norman, R. J., and J. W. Stucki. 1981. The Determination of Nitrate and Nitrite in Soil Extracts by Ultraviolet Spectrophotometry. Soil Science Society of America Journal 45:347-353. Oostenbrink, M. 1960. Estimating nematode populations by some selected methods. Pages 81-101 in J. J. Sasser, and W. R. Jenkins, editors. Nematology. Univ. of North Carolina Press, Chapel Hill. Quast, C., E. Pruesse, P. Yilmaz, J. Gerken, T. Schweer, P. Yarza, J. Peplies, and F. O. Glöckner. 2013. The SILVA ribosomal RNA gene database project: improved data processing and web-based tools. Nucleic Acids Research 41:590-596. Resch, M. C., M. Schütz, U. Graf, R. Wagenaar, W.H. van der Putten, and A. C. Risch. 2019. Does topsoil removal in grassland restoration benefit both soil nematode and plant communities? Journal of Applied Ecology 56:1782-1793. Schuldt, A., A. Ebeling, M. Kunz, M. Staab, C. Guimarães-Steinicke, D. Bachmann, N. Buchmann, W. Durka, A. Fichtner, F. Fornoff, W. Härdtle, L. R. Hertzog, A-N. Klein, C. Roscher, J. Schaller, von G. Oheimb, A. Weigelt, W. Weisser, C.Wirth, J. Zhang, H. Bruelheide, and N. Eisenhauer. 2019. Multiple plant diversity components drive consumer communities across ecosystems. Nature Communications 10:1460. Tedersoo, L., M. Bahram, S. Põlme, U. Kõljalg, N. S. Yorou, R. Wijesundera, L. Villarreal Ruiz, A. M. Vasco-Palacios, P. Q. Thu, A. Suija, M. E. Smith, C. Sharp, E. Saluveer, A. Saitta, M. Rosas, T. Riit, D. Ratkowsky, K. Pritsch, K. Põldmaa, M. Piepenbring, C. Phosri, M. Peterson, K. Parts, K. Pärtel, E. Otsing, E. Nouhra, A. L. Njouonkou, R. H. Nilsson, L. N. Morgado, J. Mayor, T. W. May, L. Majuakim, D. J. Lodge, S. See Lee, K.-H. Larsson, P. Kohout, K. Hosaka, I. Hiiesalu, T. W. Henkel, H. Harend, L.-D. Guo, A. Greslebin, G. Grelet, J. Geml, G. Gates, W. Dunstan, C. Dunk, R. Frenkhan, L. Dearnaley, A. De Kesel, T. Dang, X. Chen, F. Buegger, F. Q. Brearley, G. Bonito, S. Anslan, S. Abell, and K. Abarenkov. 2014. Global diversity and geography of soil fungi. Science 346:1256688. Thomas, G.W. 1982. Exchangeable cations. Pages 159-165 in A. L. Page, R. H. Miller, and D. R. Keeney, editors. Methods of Soil Analysis: Part 2—Chemical and microbiological properties. Soil Science Society of America (SSSA) Inc., Madison. Walthert, L., U. Graf, A. Kammer, J. Luster, D. Pezzotta, S. Zimmermann, and F. Hagedorn. 2010. Determination of organic and inorganic carbon, δ13C, and nitrogen in soils containing carbonates after acid fumigation with HCl. Journal of Plant Nutrition and Soil Sciences 173:207-216. Yeates, G. W., T. Bongers, R. G. M. de Goede, D. W. Freckman, and S. S. Georgieva. 1993. Feeding habits in soil nematode families and genera – an outline for soil ecologists. Journal of Nematology 25:315-331.82 years ago
- When snow is compressed with a certain speed, micro-snowquakes are triggered in the porous structure of bonded crystals. The present dataset covers uniaxial compression experiments of snow at different strain rates and concurrent X-ray tomography imaging documenting this feature. The experiments were conducted in a micro-compression stage operated in the X-ray tomography scanner in the SLF cold laboratory. The dataset comprises the compression force data of 17 compression experiments, the 3D image data from 4 X-ray tomography scans and the results of numerical simulations.22 years ago
- Dry weight (mass) of the aboveground parts of living trees and shrubs starting at 12 cm dbh. This consists of the tree parts: stemwood, branch coarse wood, brushwood/twigs and needles/leaves. The correction for bias with the sample Tarif trees may be so drastic that it results in negative values with small numbers of trees. __Citation:__ > _Abegg, M.; Brändli, U.-B.; Cioldi, F.; Fischer, C.; Herold-Bonardi, A.; Huber M.; Keller, M.; Meile, R.; Rösler, E.; Speich, S.; Traub, B.; Vidondo, B. (2014). Fourth national forest inventory - result tables and maps on the Internet for the NFI 2009-2013 (NFI4b). [Published online 06.11.2014] Available from World Wide Web http://www.lfi.ch/resultate/ Birmensdorf, Swiss Federal Research Institute WSL. [doi:10.21258/1057112](https://doi.org/10.21258/1057112)_22 years ago
- Increase in the volume of stemwood with bark of the surviving trees and shrubs starting at 12 cm dbh between two inventories and the losses (modelled for the half period), plus the volume of gains. *In the calculation no D7/tree height data were used. The values calculated like this have not been corrected for bias, but allow for cantons or forest districts a more robust estimation of changes and could thus be better interpreted. __Citation:__ > _Abegg, M.; Brändli, U.-B.; Cioldi, F.; Fischer, C.; Herold-Bonardi, A.; Huber M.; Keller, M.; Meile, R.; Rösler, E.; Speich, S.; Traub, B.; Vidondo, B. (2014). Fourth national forest inventory - result tables and maps on the Internet for the NFI 2009-2013 (NFI4b). [Published online 06.11.2014] Available from World Wide Web http://www.lfi.ch/resultate/ Birmensdorf, Swiss Federal Research Institute WSL. [doi:10.21258/1057112](https://doi.org/10.21258/1057112)_32 years ago
- This dataset includes data on species richness of vascular plants and bryophytes in 55 wetlands of the canton of Zürich (Switzerland) as well as recent and historic data on the area and connectivity of these 55 wetlands and was used for the paper Jamin A., Peintinger M., Gimmi U., Holderegger R., Bergamini A. (2020) Evidence for a possible extinction debt in Swiss wetland specialist plants. Ecology and Evolution. Species richness data are available for vascular plants and bryophytes. The field survey was carried out between June 5 and August 10, 2012. The survey covered all wetland (fen) types in the canton of Zürich. For data collection, at least half a day per wetland was spent searching for species. Within each wetland all different vegetation types were covered until no new species were found to get as complete species lists as possible. In the Excel file information on species richness of the following groups is provided: (1) all vascular plant species; (2) wetlands specialists among vascular plants; (3) generalists, which were all non-specialist vascular plant species; (4) short-lived vascular plant specialists; (5) long-lived vascular plant specialists; (6) short-lived vascular plant generalists; (7) long-lived vascular plant generalists; (8) bryophyte species. Specialist vascular plant species included all characteristic species listed in Appendix 1a of the wetland inventory of Switzerland (BUWAL, 1990). Based on the data of Gimmi et al. (2011), the area of all wetlands in 1850, 1900, 1950 and 2000 were determined as well as the wetland area within buffers 2km in radius with the center of the wetland as starting point. These data are also provided in the Excel sheet. Moreover, for each wetland mean indicator values according to Landolt et al. (2010) and the standard deviation of these indicator values based on presence-absence data of vascular plants were calculated and are provided in Excel sheet. Indicator values for temperature, light availability, moisture, acidity, nutrients, amount of humus and soil aeration were considered.12 years ago
- This data set provides estimates of annual fresh water fluxes related to sea-ice formation from ocean freezing and snow-ice formation, sea-ice melting, lateral transport of sea ice in the Southern Ocean over the period 1982 to 2008.It is derived from a mass balance calculation of local sea-ice volume change and divergence from satellite data and sea-ice reconstructions. The mass balance is calculated on a daily basis and fluxes are then integrated over the entire year, where a year is defined from March to February of the next year (i.e. from March 1982 to February 2009). This approach combines multiple products of sea-ice concentration (Cavalieri & Parkinson, 2008;Comiso, 1986; Meier et al., 2013), sea-ice thickness (Kurtz & Markus, 2012; Massonnet et al., 2013; Worby et al., 2008), and sea-ice drift (Fowler et al., 2013; Kwok 2005; Schwegmann et al., 2011). For a detailed description of the method see Haumann et al. (2016). The data set is derived to estimate large-scale (regional to basin-scale) fluxes on an annual basis. Our confidence is reduced on a grid cell basis, such as for single coastal polynyas, where the method and underlying data induce large, unknown uncertainties. _Disclaimer: This data set is free to use for any non-commercial purpose at the risk of the user and the authors do not take any liability on the use of the data set. The authors assembled the data set carefully and assessed accuracy, errors, and uncertainties. Please contact the authors if you find any issues._ __Related publication__: http://www.nature.com/nature/journal/v537/n7618/full/nature19101.html (doi:10.1038/nature19101) Disclaimer: This data set is free to use for any non-commercial purpose at the risk of the user and the authors do not take any liability on the use of the data set. The authors assembled the data set carefully and assessed accuracy, errors, and uncertainties. Please contact the authors if you find any issues.42 years ago
- Volume of stemwood with bark of all living and dead trees and shrubs starting at 12 cm dbh recorded according to the NFI1 method. In NFI1 only those dead trees were recorded whose wood could still be exploited. The correction for bias with the sample Tarif trees may be so drastic that it results in negative values with small numbers of trees. __Citation:__ > _Abegg, M.; Brändli, U.-B.; Cioldi, F.; Fischer, C.; Herold-Bonardi, A.; Huber M.; Keller, M.; Meile, R.; Rösler, E.; Speich, S.; Traub, B.; Vidondo, B. (2014). Fourth national forest inventory - result tables and maps on the Internet for the NFI 2009-2013 (NFI4b). [Published online 06.11.2014] Available from World Wide Web http://www.lfi.ch/resultate/ Birmensdorf, Swiss Federal Research Institute WSL. [doi:10.21258/1057112](https://doi.org/10.21258/1057112)_12 years ago
- Number of species of living trees and shrubs starting at 40 cm plant height that occur within a 200 m2 sample plot. __Citation:__ > _Abegg, M.; Brändli, U.-B.; Cioldi, F.; Fischer, C.; Herold-Bonardi, A.; Huber M.; Keller, M.; Meile, R.; Rösler, E.; Speich, S.; Traub, B.; Vidondo, B. (2014). Fourth national forest inventory - result tables and maps on the Internet for the NFI 2009-2013 (NFI4b). [Published online 06.11.2014] Available from World Wide Web http://www.lfi.ch/resultate/ Birmensdorf, Swiss Federal Research Institute WSL. [doi:10.21258/1057112](https://doi.org/10.21258/1057112)_22 years ago
-  LWF Plot Schänis - Community: Schänis / canton SG - Date of installation: 17 September 1997 - Size of the plot: 2 ha - Altitude: 693-773 m - Mean slope: 60% - Geology (in German): Tertiär. Subalpine Molasse, Oligocaen, Chattien, Kalknagelfluh - Soil types (WSL) : n.d. - Woodland association after EK72: 13: Cardamino-Fagetum tilietosum - Main tree species: Fagus sylvatica - Management system: high forest - Silvicultural system: group selection - Top-height diameter (quadratic average diameter of the 100 thickest trees per ha): 55.8 cm - Number of trees BHD >= 12 cm (2011): 611 - Maximum tree age: Abies alba130-150 yr - Fraxinus excelsior 130-150 yr - Fagus sylvatica 130-150 yr More Information: https://www.wsl.ch/en/forest/forest-development-and-monitoring/long-term-forest-ecosystem-research-lwf/sites/schaenis.html22 years ago
- ## Summary * Dataset of daily inflow to Luzzone reservoir in Ticino, Switzerland * R scripts used to generate return levels for low reservoir inflow, low precipitation, high inflow, and extreme high precipitation based on various methods from extreme value analysis ## Data The dataset included here is the "natural" reservoir inflow for the Luzzone reservoir. Additional analyses were conducted on daily total precipitation of 6 meteorological stations (abbreviations: TIOLI, TIOLV, COM, VRN, VLS, ZEV). These precipitation data are freely available for teaching and research from the MeteoSwiss IDAweb portal (https://www.meteoswiss.admin.ch/services-and-publications/service/weather-and-climate-products/data-portal-for-teaching-and-research.html). ## Codes R scripts used to determine return levels of the data set are included for both extreme high events and low events. The scripts include the following methods for calculating return levels: * GEV (Generalized Extreme Value) * GPD and GPDd (Generalized Pareto Distribution including declustered version) * eGPD (extended Generalized Pareto Distribution) * MEV (Metastatistical Extreme Value)22 years ago
- Data and code for the publication. The data is raw data. Processed data can be obtained upon request.72 years ago
- We modelled the spatial distribution of 20 permanent grassland habitats at the level of phytosociological alliances according to the Swiss habitat typology (TypoCH; Delarze et al. 2015) at 10x10 m resolution across Switzerland. The 20 grassland habitat types belong to the following habitat groups: fens, wet meadows, raised bogs, re-seeded and heavy fertilized grasslands, dry grasslands, nutrient-poor alpine and subalpine grasslands, nutrient-rich pastures and meadows as well as fallow grasslands. We followed a two-step approach: (1) Ensemble models provide **distribution maps of the 20 individual grassland habitat types**, using training data from various sources. Predictors were Copernicus Sentinel satellite imagery and variables describing climate, soil and topography. The performance of these maps was assessed with the True Skill Statistics and split‐sampling of the data. Available maps for each grassland habitat: (1) *Map of the median of predicted probability of occurrence*; (2) *Map of the standard deviation of the predicted probability of occurrence* (available upon request); (3) *Binary presence/absence map* (available upon request). For an overview, see *Overview: Maps of the individual grassland habitats*. (2) **Combined maps**: The individual maps were combined into countrywide maps of the most and second most likely habitat type, respectively, using an expert‐based weighting approach. The performance of the combined map for the most likely habitat type was assessed via an independent testing dataset and a comparison of the predicted habitat‐type proportions with extrapolations from field surveys. Available combined maps: Map of the most likely habitat type (M1F; after regional corrections); Map of the second most likely habitat type (M2); Map of the most likely habitat type without regional corrections (available upon request); Map of the weighted median of the predicted probability of occurrence for the most/second most likely habitat type, respectively (available upon request); map of the ratio of the probabilities of occurrence of the most and second most likely habitat types (available upon request)242 years ago
- R scripts and demonstration data for end-member mixing and splitting: using isotopes and other tracers to determine where streamflow comes from (end-member mixing) and where precipitation goes (end-member splitting). # This package includes two R scripts: # "EndSplit_v1.0_20200516.R" implements end-member mixing and splitting. "EndSplit_demo_v1.0_20200516.R" demonstrates the application of EndSplit to the Hubbard Brook Watershed 3 isotope data set (see below). Both of these scripts are copyright (C) 2020 ETH Zurich and James Kirchner. Public use is permitted under GNU General Public License 3 (GPL3); for details see https://www.gnu.org/licenses/ But… READ THIS CAREFULLY: ETH Zurich and James Kirchner make ABSOLUTELY NO WARRANTIES OF ANY KIND, including NO WARRANTIES, expressed or implied, that this software is free of errors or is suitable for any particular purpose. Users are solely responsible for determining the suitability and reliability of this software for their own purposes. These scripts implement end-member mixing and end-member splitting, as described in Kirchner and Allen, "Seasonal partitioning of precipitation between streamflow and evapotranspiration, inferred from end-member splitting analysis", Hydrology and Earth System Sciences, 24, 17-39, https://doi.org/10.5194/hess-24-17-2020, 2020. Users publishing results based on these scripts should cite that paper. Build 2020.05.16 is a minor bug fix of build 2019.10.25, which was previously released as EndSplit_v1.0_20191025.R. # The zip file "demonstration input data.zip" contains 8 demonstration data files (all tab-delimited text): # "Hubbard Brook WS3 isotope data split by sampling date.txt" contains streamflow and precipitation isotope data from Hubbard Brook Watershed 3 isotope data (Campbell and Green, 2019). "Hubbard Brook WS3 daily P and Q 1956-2014.txt" contains daily precipitation and streamflow totals for Hubbard Brook Watershed 3. (USDA Forest Service Northern Research Station, 2016a and 2016b). "Hubbard Brook WS3 isotope data WY2007.txt", "Hubbard Brook WS3 isotope data WY2008.txt", "Hubbard Brook WS3 isotope data WY2009.txt", "Hubbard Brook WS3 daily P and Q WY2007.txt", "Hubbard Brook WS3 daily P and Q WY2008.txt", and "Hubbard Brook WS3 daily P and Q WY2009.txt" contain subsets of these data for the designated water years. As the work product of US federal employees, the data in these files are in the public domain. However, any users of these data should cite the original sources: Campbell, J. L., and Green, M. B.: Water isotope samples from Watershed 3 at Hubbard Brook Experimental Forest, 2006-2010, https://doi.org/10.6073/pasta/f5740876b68ec42b695c39d8ad790cee, 2019. USDA Forest Service Northern Research Station: Hubbard Brook Experimental Forest (US Forest Service): Daily Streamflow by Watershed, 1956 - present, https://doi.org/10.6073/pasta/38b11ee7531f6467bf59b6f7a4d9012b, 2016a. USDA Forest Service Northern Research Station: Hubbard Brook Experimental Forest (US Forest Service): Total Daily Precipitation by Watershed, 1956 - present, https://doi.org/10.6073/pasta/163e416fb108862dc6eb857360fa9c90, 2016b. # The zip file "demonstration output files.zip" contains demonstration output files # These tab-delimited text files were generated by running EndSplit_demo_v1.0_20200516.R (which in turn calls EndSplit_v1.0_20200516.R) under R version 3.6.0, using the input files contained in "demonstration input data.zip"42 years ago
- Attention: this data is not updated after 2022 anymore. This dataset contains the statistics on the number of avalanche fatalities per **calendar year** in Switzerland. The data collection commences with the beginning of the year 1937. After the completion of a hydrological year, which is the standard way avalanche fatalities are summarized in Switzerland and ends on the 30th of September, the new data is appended to the existing dataset. If you require annual statistics per hydrological year, please download the data from here: [https://www.envidat.ch/dataset/avalanche-fatalities-switzerland-1936] The following information is contained (by column and column title): - year - number of fatalities in the backcountry (=tour) - number of fatalities in terrain close to ski areas (=offpiste, away from open and secured ski runs) - number of fatalities on transportation corridors including ski runs, roads, railway lines (=transportation.corridors) - number of fatalities in or around buildings or in settlements (= buildings) - sum (of all four categories) The definitions for these four categories, as described in the guidelines to the avalanche accident database are: __tour:__ activities include back-country ski, snowboard or snow-shoe touring __offpiste:__ access from ski area, generally from the top of a skilift with short hiking distances __transportation.corridors__ (Techel et al., 2016): people travelling or recreating on open or temporarily closed transportation corridors (e.g. a road user or a skier on a ski run) and people working on open or closed transportation corridors (e.g. maintenance crews on roads, professional rescue teams) __buildings__ (Techel et al., 2016): people inside or just outside buildings, and workers on high alpine building sites12 years ago
- This database contains 1957 distribution maps of species from Fagales and Pinales constructed based on a method integrating polygon mapping and SDMs (Lyu et al., 2022). To construct the maps, we first collected occurrence data from 48 different sources. According to the number of occurrences after data cleaning, three kinds of maps are constructed: (1) For species with more than 20 occurrences, we performed SDM and polygon mapping described in Lyu et al. (2022) and select the integration of the two layers as the distribution range; (2) For species with more than 4 but less than 20 occurrences, we only use polygon mapping to draw the distribution range; (3) For species with less than 4 occurrences, a 20-km buffer was generated around the occurrences as the distribution range. The maps were manually checked and evaluated (see Note S3 and Table S9 in Lyu et al., 2022 for details).22 years ago
- The data set contains the danger descriptions (German) of the avalanche forecasts published at 5 pm between 27-Nov-2012 and 13-Feb-2020.12 years ago
- Assessment of coarse woody debris on LWF plots using the line intersect method ### Purpose: ### Assessing the amount of coarse woody debris ### Manual Citation: ### * Matthias Dobbertin, Nathalie Bretz Guby, 1997: Totholz. In: Peter Brang (ed.) LWF Aufnahmeanleitung. Langfristige Waldökosystem-Forschung LWF, Eidg. Forschungsanstalt WSL, Birmensdorf, 5 S. ### Paper Citation: ### * Bretz Guby, N.A., Dobbertin, M., 1996. Quantitative estimates of coarse woody debris and standing dead trees in selected Swiss forests. Glob. Ecol. Biogeogr. Lett. 5, 327-341.12 years ago
- Data and scripts used by Scherrer et al. 2023 in the publication 'Maintaining the protective function of mountain forests under climate change by the concept of naturalness in tree species composition'. The analysis is based on data about the tree species composition of the canopy layer in the NFI4 and information about the potential natural forest of the sites based on the NaiS classification system.22 years ago
- Sum of stem cross-section areas of all dead trees in a stand at a height of 1.3 m (dbh measurement height) recorded according to the NFI1 method. __Citation:__ > _Abegg, M.; Brändli, U.-B.; Cioldi, F.; Fischer, C.; Herold-Bonardi, A.; Huber M.; Keller, M.; Meile, R.; Rösler, E.; Speich, S.; Traub, B.; Vidondo, B. (2014). Fourth national forest inventory - result tables and maps on the Internet for the NFI 2009-2013 (NFI4b). [Published online 06.11.2014] Available from World Wide Web http://www.lfi.ch/resultate/ Birmensdorf, Swiss Federal Research Institute WSL. [doi:10.21258/1057112](https://doi.org/10.21258/1057112)_12 years ago
- This repository contains PMCMx-UF model outputs used for the paper: D. Patoulias K. Florou S. N. Pandis and A. Nenes: New particle formation events can reduce cloud droplets in boundary layer clouds at the continental scale, Geophysical Research Letters, in review, 2023.12 years ago
- For the release of a slab avalanche, crack propagation within a weak snowpack layer below a cohesive snow slab is required. As crack speed measurements can give insight into the underlying processes, we analysed three crack propagation events that occurred in similar snowpacks and covered all scales relevant for avalanche release. For the largest scale, up to 400 m, we estimated crack speed from an avalanche movie, for scales between 5 and 25 meters, we used accelerometers placed on the snow surface, and for scales below 5 meters, we performed a Propagation Saw Test. The mean crack speeds ranged from 36 ± 6 to 49 ± 5 m s^{-1}, and did not exhibit scale dependence. Using the Discrete Element Method and the Material Point Method, we reproduced the measured crack speeds reasonably well, in particular the terminal crack speed observed at smaller scales. This dataset includes raw data as well as crack speed estimates from the three crack propagation events. Where possible, we reproduced these field experiments with numerical models based on Discrete Element Method (DEM, Bobillier and others, 2020 and 2021) and Material Point Method (MPM. Gaume and others, 2018 and Trottet and others, 2021). The input parameters of the models were estimated from the corresponding snow profiles conducted at each test site. ## The raw data include: * Propagation Saw Test movie with mechanical fields derived from Digital image Correlation analysis of the recording * Acceleration data recorded with wireless time synchronized accelerometers placed on the snow surface during crack propagation in a whumpf. *Video of an artificially triggered avalanche with widespread crack propagation. The video was used to georeference surface cracks in order to estimate crack propagation time and distance, providing crack propagation speed estimates. * Snow profile recorded at each test site ## Experimental crack speed estimates include: * Crack speed evolution within the first meters derived from the Propagation Saw Test. * Crack speeds estimated from the time delay of the collapse, observed between different accelerometers during crack propagation of a whumpf. * Crack speed estimates from video analysis of the artificially triggered avalanche. ## Reproduced crack speeds using the DEM an MPM model: * Modelled Propagation Saw Test using MPM (2D and 3D system) and DEM. * Modelled whumpf using MPM (beam and areal configuration) * Modelled avalanche using MPM (beam and areal configuration) Beside the movies (mp4 format), all data is either provided as netCDF files or excel sheets (see readme file), depending on the amount of data. A detailed description of the three crack propagation events and how crack speed was derived, can be found in the related publication: ### References for applied models: Bobillier, G., B. Bergfeld, A. Capelli, J. Dual, J. Gaume, A. van Herwijnen and J. Schweizer 2020. Micromechanical modeling of snow failure. The Cryosphere, 14(1): 39-49. Bobillier, G., B. Bergfeld, J. Dual, J. Gaume, A. van Herwijnen and J. Schweizer 2021. Micro-mechanical insights into the dynamics of crack propagation in snow fracture experiments. Scientific Reports, 11: 11711. Gaume, J., T. Gast, J. Teran, A. van Herwijnen and C. Jiang 2018. Dynamic anticrack propagation in snow. Nature Communications, 9(1): 3047. Trottet, B., R. Simenhois, G. Bobillier, A. van Herwijnen, C. Jiang and J. Gaume 2021. From sub-Rayleigh to intersonic crack propagation in snow slab avalanche release. EGU General Assembly 2021, Online, 19-30 Apr 2021, EGU21-8253.22 years ago
- This dataset contains number concentrations of ice-nucleating particles active at -15 °C observed at Weissfluhjoch during February and March 2019, as well as complementary data (measured aerosol number concentrations and modelled total precipitation along air mass trajectories). This data formed the basis of our paper with the title “Towards parameterising atmospheric concentrations of ice-nucleating particles active at moderate supercooling”.12 years ago
- Phenological observations are recorded every 14 days on LWF plots where throughfall and bulk precipitation are sampled. The percentage of foliage in reference to its maximum potential development in summer, the percentage of foliage with autumnal discoloration and the percentage of fallen leaves (broadleaved stands) are estimated at the plot level. At two LWF plots (Othmarsingen, Vordemwald), phenological stages are documented on individual trees ### Purpose: ### To document the seasonal development of the canopy of trees and shrubs at the plot level12 years ago
- High quality meteorological data are needed for long-term forest ecosystem research, particularly in the light of global change. The long-term data series published here comprises almost 20 years of measurements for two meteorological stations in Chironico in Switzerland where one station is located within a natural coniferous forest stand (CIB) with Norway spruce (_Picea abies_; 160-180 yrs) and European silver fir (_Abies alba_; 140-160 yrs) as dominant tree species. A second station is situated in the very vicinity outside of the forest (field station, CIF). The meteorological time series are presented in hourly time resolution of air temperature, relative humidity, precipitation, photosynthetically active radiation (PAR) and wind speed. Chironico is part of the Long-term Forest Ecosystem Research Programme (LWF) established and maintained by the Swiss Federal Research Institute WSL.72 years ago
- Observational data used to quantitatively describe the key elements describing avalanche danger: snowpack stability, the frequency distribution of snowpack stability, and avalanche size. The data set consists of - Rutschblock test results (Switzerland) - Extended Column Test results (Switzerland, Norway) - Avalanche occurrence data (Switzerland, Norway). The data were extracted from the respective operational databases of the national avalanche warning services in Switzerland (WSL Institute for Snow and Avalanche Research SLF Davos, Switzerland) and Norway (The Norwegian Water Resources and Energy Directorate NVE). For further information regarding the data, please refer to the publication or contact the author.42 years ago
- Volume of stemwood with bark of all trees and shrubs starting at 12 cm dbh that died or disappeared between two inventories and that were not harvested. The correction for bias with the sample Tarif trees may be so drastic that it results in negative values with small numbers of trees. __Citation:__ > _Abegg, M.; Brändli, U.-B.; Cioldi, F.; Fischer, C.; Herold-Bonardi, A.; Huber M.; Keller, M.; Meile, R.; Rösler, E.; Speich, S.; Traub, B.; Vidondo, B. (2014). Fourth national forest inventory - result tables and maps on the Internet for the NFI 2009-2013 (NFI4b). [Published online 06.11.2014] Available from World Wide Web http://www.lfi.ch/resultate/ Birmensdorf, Swiss Federal Research Institute WSL. [doi:10.21258/1057112](https://doi.org/10.21258/1057112)_22 years ago
- **When using this data, please consider and adhere to the associated [Terms of Use](https://www.slf.ch/en/services-and-products/data-and-monitoring/slf-data-service.html)**. This data collection contains information concerning all known accidents by snow avalanches in Switzerland with at least one person involved (caught). The data set commences on 01/10/1970. After the completion of a hydrological year, the new data is added. The following information is provided: * avalanche identifier * date of the accident * accuracy of the date in range of days before and after * canton * municipality * start zone point latitude * start zone point longitude * start zone point accuracy (in meters) * start zone point elevation (in meteres above sea level) * slope aspect (main orientation of start zone) * slope inclination (in degree, steepest point within start zone) * forecasted avalanche danger level 1 (first danger) * forecasted avalanche danger level 2 (second danger) * accident within the core zone (most dangerous aspect and elevation as mentioned in the forecast) * number of dead persons * number of caught persons * number of fully buried persons * activity/location of the accident party at the time of the incident12 years ago
- This Weissfluhjoch dataset is a processed version of the Weissfluhjoch dataset version 6 from https://doi.org/10.16904/6. This dataset was specially created for the ESM-SnowMIP project. Here it is documented how this dataset has been created.42 years ago
- NH₃ concentrations were measured at 11 LWF plots (1999/2000) with Zürcher passive samplers (Palmes-type diffusion tubes with an acidic solution as absorbent) during one year. Three samplers per site and period (usually 14 days) were installed in the open area of the LWF plots and, at Beatenberg, Novaggio and Vordemwald, under the forest as well (weather station). In 2014, NH₃ concentrations were measured again at 14 plots, using two Radiello samplers per site and period (usually 28 days). At Lausanne and Vordemwald, concentrations were also measured below the canopy. ### Purpose: ### To assess air concentrations of ammonia (NH₃) and, using deposition velocities available from the literature, to quantify the dry deposition of NH₃ (alternative method to the throughfall method). The LWF plots were part of a larger network covering the main regions of Switzerland. One objective of this larger network was to compare measured and modelled concentrations.12 years ago
- The data described in this article were collected daily over the period 4 June 2018 to 23 August 2018 and contains information of several data sources. The database includes information on national recipes and their ingredients for 171 countries, measures for food taste similarities between all 171 countries as well as bilateral migration and agro-food trade data for 5 years. The database can be used for analyzing e.g., the relation between food preferences and international trade or food preferences and health outcomes (e.g., obesity) across countries.32 years ago
- # Nuclear microsatellite markers and genotype data for _Trichopria ddrosophilae_ This data set comprises (i) the characteristics of a set of 21 species-specific nuclear microsatellites for PCR amplification in _Trichopria drosophilae_ (ii) and genotype data for samples collected in southern Switzerland (Canton of Ticino), with few reference samples from Canton of Vaud, southern Germany, and northern Italy (lab-reared population). Markers were developed by Ecogenics GmbH, Balgach (Switzerland), using MiSeq Nano 2x250 v2 format (on a mix of 10 individuals). Multiplex PCR assays for multilocus genotyping were established by Ecological Genetics (WSL Birmensdorf), and population genetic analyses are found in Gugerli et al., Agrarforschung Schweiz 2019.22 years ago
- This data set contains the produced snow depth maps as well as the reference data set (manual and snow pole measurements) from our paper "Intercomparison of photogrammetric platforms for spatially continuous snow depth mapping". __Abstract.__ Snow depth has traditionally been estimated based on point measurements collected either manually or at automated weather stations. Point measurements, though, do not represent the high spatial variability of snow depths present in alpine terrain. Photogrammetric mapping techniques have progressed in recent years and are capable of accurately mapping snow depth in a spatially continuous manner, over larger areas, and at various spatial resolutions. However, the strengths and weaknesses associated with specific platforms and photogrammetric techniques, as well as the accuracy of the photogrammetric performance on snow surfaces have not yet been sufficiently investigated. Therefore, industry-standard photogrammetric platforms, including high-resolution satellites (Pléiades), airplane (Ultracam Eagle M3), Unmanned Aerial System (eBee+ with S.O.D.A. camera) and terrestrial (single lens reflex camera, Canon EOS 750D), were tested for snow depth mapping in the alpine Dischma valley (Switzerland) in spring 2018. Imagery was acquired with airborne and space-borne platforms over the entire valley, while Unmanned Aerial Systems (UAS) and terrestrial photogrammetric imagery was acquired over a subset of the valley. For independent validation of the photogrammetric products, snow depth was measured by probing, as well as using remote observations of fixed snow poles. When comparing snow depth maps with manual and snow pole measurements the root mean square error (RMSE) values and the normalized median deviation (NMAD) values were 0.52 m and 0.47 m respectively for the satellite snow depth map, 0.17 m and 0.17 m for the airplane snow depth map, 0.16 m and 0.11 m for the UAS snow depth map. The area covered by the terrestrial snow depth map only intersected with 4 manual measurements and did not generate statistically relevant measurements. When using the UAS snow depth map as a reference surface, the RMSE and NMAD values were 0.44 m and 0.38 m for the satellite snow depth map, 0.12 m and 0.11 m for the airplane snow depth map, 0.21 and 0.19 m for the terrestrial snow depth map. When compared to the airplane dataset over a large part of the Dischma valley (40 km2), the snow depth map from the satellite yielded a RMSE value of 0.92 m and a NMAD value of 0.65 m. This study provides comparative measurements between photogrammetric platforms to evaluate their specific advantages and disadvantages for operational, spatially continuous snow depth mapping in alpine terrain over both small and large geographic areas.72 years ago
- Flavescence dorée (FD) is a grapevine disease caused by associated phytoplasmas (FDp), which are epidemically spread by their main vector Scaphoideus titanus. The possible roles of alternative and secondary FDp plant hosts and vectors have gained interest to better understand the FDp ecology and epidemiology. A survey conducted in the surroundings of a vineyard in the Swiss Southern Alps aimed at studying the possible epidemiological role of the FDp secondary vector Orientus ishidae and the FDp host plant Alnus glutinosa is reported. Data used for the publication. Insects were captured by using a sweeping net (on common alder trees) and yellow sticky traps (Rebell Giallo, Andermatt Biocontrol AG, Switzerland) placed in the vineyard canopy. Insects were later determined and selected for molecular analyses. Grapevines and common alder samples were collected using the standard techniques. The molecular analyses were conducted in order to identify samples infected by the Flavescence dorée phytoplasma (16SrV-p) and the Bois Noir phytoplasma (16SrXII-p). A selection of the infected sampled were further characterized by map genotype and sequenced in order to compare the genotypes in insects, grapevines and common alder trees.72 years ago
- In 1994 a large area of mountain spruce forest was infested by the European spruce bark beetle (Ips typographus) in the Gandberg forest near Schwanden, canton Glarus, Switzerland (46.99145 N, 9.10768 E, 1300 m a.s.l.). In a perimeter of approx. 13 ha, 50 infested dead spruce trees were selected and labelled in 1994. The trees were randomly distributed across the whole perimeter and attributed to 5 groups of 10 trees of approx. 25-40 cm diameter each. In each of the following 5 years (1995-1999), the trees of one of these groups were cut in early spring and transported by helicopter to a vehicle-accessible road. Of each log, two bolts of 1.5 m length were cut, one from the base and one from the beginning of the crown. The bolts were transported by truck to the institute WSL and exposed in emergence eclectors (metal cabinets of approx. 2.0x0.5x0.5 m) in a greenhouse to let the insects emerge. Each tree was left 2 years in the eclectors to allow insects with more than 1 year development time to emerge. During 2 months in the winter between the two exposure years the bolts were removed from the eclectors and exposed to ambient winter temperatures for chilling. They were then moved back to the eclectors in the greenhouse. Additionally, 18 living unattacked trees were provided with a pheromone lure in early spring 1995 to induce new bark beetle attack. 10 infested trees were then cut and processed as described above. The water-filled emergence traps of the eclectors were emptied monthly-bimonthly and the insects were separated to taxonomic groups and eventually identified by specialists. Before disposing the logs, tree age was recorded by tree-ring-counting.12 years ago
- The study aims to determine the effective elastic properties of snow, firn, and bubbly ice based on microstructural quantities. Anisotropy, one of these quantities (the other being ice volume fraction) in snow and ice, has two types: geometrical and crystallographic, resulting in snow's macroscopic anisotropic elastic behavior. The research focuses on the impact of geometrical anisotropy on potential ice volume fractions in snow and ice. 391 micro-CT images from various locations, including laboratories, the Alps, the Arctic, and Antarctica, were analyzed to achieve this. The analysis involved microstructure-based finite element simulations, which inherently consider microstructure and calculate the elasticity tensor. Hashin-Shtrikman bounds were utilized to predict the elastic properties of the microstructure samples. These bounds effectively captured the nonlinear interplay between geometrical anisotropy, captured by the Eshelby tensor and density. HS bounds have the advantage of the correct limiting behavior for low to high-ice volume fractions. We derived parameterization for five transversely isotropic elasticity tensor components, requiring only two free parameters. This parameterization was valid for ice volume fractions ranging from 0.06 to 0.93. The analysis employing the Thomsen parameter highlighted the dominance of geometrical anisotropy until an ice volume fraction of 0.7. However, to fully comprehend the elasticity of bubbly ice, a comprehensive approach is necessary to integrate coupled elastic theories that account for both geometrical and crystallographic anisotropy. This dataset includes a Jupyter notebook with all the necessary functions required to predict the elasticity tensor of snow for the given ice volume fraction and anisotropy. Also, the code contains the least squares optimization function to compute the elasticity tensor for the six components of stress and strain. For example, we consider our dataset to calculate the samples' elasticity tensor and reproduce Fig. 7 from the paper. We take the stress and strain values obtained from load states as input for this example. Also, a .csv file contains all the microstructural information: ice volume fraction, anisotropy, correlation functions, voxels size, and no. of voxels of the samples and the elasticity tensor obtained from finite element simulations and from present work parameterization.12 years ago
- Volume of stemwood with bark of all trees and shrubs starting at 12 cm dbh removed from the forest as a result of damage occurring between two inventories, in this case insects, and not because of management planning. This feature is derived on the level of a sample plot from the cutting of the sample trees and the salvage cut proportion (according to information from the forester). *In the calculation no D7/tree height data were used. The values calculated like this have not been corrected for bias, but allow for cantons or forest districts a more robust estimation of changes and could thus be better interpreted. __Citation:__ > _Abegg, M.; Brändli, U.-B.; Cioldi, F.; Fischer, C.; Herold-Bonardi, A.; Huber M.; Keller, M.; Meile, R.; Rösler, E.; Speich, S.; Traub, B.; Vidondo, B. (2014). Fourth national forest inventory - result tables and maps on the Internet for the NFI 2009-2013 (NFI4b). [Published online 06.11.2014] Available from World Wide Web http://www.lfi.ch/resultate/ Birmensdorf, Swiss Federal Research Institute WSL. [doi:10.21258/1057112](https://doi.org/10.21258/1057112)_22 years ago
- Book of abstracts from the virtual conference "From Plans to Land Change: Dynamics of Urban Regions" Cities and urban regions are among the most dynamic land-use systems in the world, with dramatic consequences for the provision of ecosystem services and the livelihood of people. Planning is a multifaceted activity with extensive experience in the management of these urbanization processes. However, our understanding of planning’s contribution to shaping urban land use, form and structure is still incomplete, with serious consequences for the efficacy of urban planning and land change models. This international conference aims to bring together the community of scholars working on planning evaluation and urban modelling. The participants are offered the opportunity to present their current research and to discuss how theoretical developments, data sources, comparative studies and modelling approaches might advance the field. The conference was financially supported by the CONCUR project and sustained by Swiss Federal Research Institute WSL.12 years ago
- This data set includes the modeling results described in the research article by Bobiller et al. (2020). All the figures in the article can be reproduced with the data provided.32 years ago
- Climate data matching the scales at which organisms experience climatic conditions are often missing. Yet, such data on microclimatic conditions are required to better understand climate-change impacts on biodiversity and ecosystem functioning. Here we combine a national network of microclimate temperature measurements with a novel radiative transfer model to map monthly minimum, mean and maximum temperatures during the vegetation period at a 10 meter spatial resolution across Switzerland. The temperature measurements took place in 107 sampling plots distributed across different habitat types, with 62 plots in forests, 22 below trees outside forests, and 23 in open grasslands. In each plot we measured temperature in the topsoil (-5cm), as well as in the air at 5cm and 100cm height above ground. Spatial interpolation was achieved by using a hybrid approach based on linear mixed effects models with input from detailed radiation estimates that account for topographic and vegetation shading, as well as other predictor variables related to the macroclimate, topography and vegetation height. Our data reveals strong horizontal and vertical variability in microclimate temperature, particularly for maximum temperatures at 5 cm above the ground and within the topsoil. Compared to macroclimate conditions as measured by weather stations outside forests, diurnal air and topsoil temperature ranges inside forests were reduced by up to 3.0 and 7.8 °C, respectively, while below trees outside forests, e.g. in hedges and below solitary trees, this buffering effect was 1.8 and 7.2 °C. We also found that in open grasslands, maximum temperatures at 5 cm above ground are on average 3.4 °C warmer than that of macroclimate, suggesting that in such habitats heat exposure close to the ground is often underestimated when using macroclimatic data. After accounting for macroclimate effects, microclimate patterns were primarily driven by radiation, with particularly strong effects on maximum temperatures. Results from spatial block cross-validation revealed predictive accuracies as measured by RSME’s ranging from 1.18 to 3.43 °C, with minimum temperatures generally being predicted more accurately than maximum temperatures. The microclimate maps presented here enable a more biologically relevant perspective when analysing climate-species interactions, which is expected to lead to a better understanding of biotic and ecosystem responses to climate and land use change.32 years ago
- The attached data are some large GIS raster files (GeoTIFFs) made with Natural Earth data. Natural Earth is a free vector and raster map data @ naturalearthdata.com. The data used for creating these large files was the "Cross Blended Hypso with Shaded Relief and Water". Data was concatenated to achieve larger and larger files. Internal pyramids were created, in order that the files can be opened easily in a GIS software such as QGIS or by a (future) GIS data visualisation module integrated in EnviDat. Made with Natural Earth. Free vector and raster map data @ naturalearthdata.com82 years ago
- Survey of spatial planning instruments and the organization of land use planning in Swiss municipalities. In 2014, the survey was sent to all Swiss municipalities in letter and online form. The response rate of 69% (i.e. 1619 of 2352 municipalities at this time) results in a representative sample of Swiss municipalities. The survey contains questions on the implementation of 20 specific planning instruments and the decade they had been implemented at first, as well as details on the local planning regimes.62 years ago
- Naturally, large parts of the Swiss Plateau are characterised by wetlands and meandering rivers. That this is no longer the case today is the result of centuries of efforts to obtain dry land. But how did this process take place? What were the relevant actors and what were their motivations? And what can be said about the ecological consequences of this development? In a research project on the history of wetlands in Switzerland since 1700, we conducted (a) a historical analysis of the development of land use in wetlands and the actors involved, (b) a historical-cartographic reconstruction of wetland extent since 1850 and (c) an evaluation of ecological effects of changes in wetlands on various organisms groups. The series of GIS layers on wetland history stem from the second part of the project. The area reconstruction is based on digitized and homogenized signatures from national map series, as they have been available since about 1850. Details about the digitalization process and the homogenization procedures applied ("Rekonstruktionen") are included in Stuber & Bürgi 2019. __Book Citation:__ > Stuber M, Bürgi M (2019) Vom «eroberten Land» zum Renaturierungsprojekt. Geschichte der Feuchtgebiete in der Schweiz seit 1700. "Bristol Schriftenreihe", Band 59. Haupt Verlag, Bern, Stuttgart, Wien. 262 Seiten.12 years ago
- Novel methods to correct for observer and sampling bias in presence-only species distribution modelsAim: While species distribution models (SDMs) are standard tools to predict species distributions, they can suffer from observation and sampling biases, particularly presence-only SDMs that often rely on species observations from non-standardized sampling efforts. To address this issue, sampling background points with a target-group strategy is commonly used, although more robust strategies and refinements could be implemented. Here, we exploited a dataset of plant species from the European Alps to propose and demonstrate efficient ways to correct for observer and sampling bias in presence-only models. Innovation: Recent methods correct for observer bias by using covariates related to accessibility in model calibrations (classic bias covariate correction, Classic-BCC). However, depending on how species are sampled, accessibility covariates may not sufficiently capture observer bias. Here, we introduced BCCs more directly related to sampling effort, as well as a novel corrective method based on stratified resampling of the observational dataset before model calibration (environmental bias correction, EBC). We compared, individually and jointly, the effect of EBC and different BCC strategies, when modelling the distributions of 1’900 plant species. We evaluated model performance with spatial block split-sampling and independent test data, and assessed the accuracy of plant diversity predictions across the European Alps. Main conclusions: Implementing EBC with BCC showed best results for every evaluation method. Particularly, adding the observation density of a target group as bias covariate (Target-BCC) displayed most realistic modelled species distributions, with a clear positive correlation (r≃0.5) found between predicted and expert-based species richness. Although EBC must be carefully implemented in a species-specific manner, such limitations may be addressed via automated diagnostics included in a provided R function. Implementing EBC and bias covariate correction together may allow future studies to address efficiently observer bias in presence-only models, and overcome the standard need of an independent test dataset for model evaluation.12 years ago
- This repository contains all WRF model outputs and observational data sets used for the paper: Georgakaki, P., Sotiropoulou, G., Vignon, É., Billault-Roux, A.-C., Berne, A., and Nenes, A.: Secondary ice production processes in wintertime alpine mixed-phase clouds, Atmos. Chem. Phys. Discuss., https://doi.org/10.5194/acp-2021-760, in review, 2021.22 years ago
- Forests cover about a third of the European land area and provide a multitude of ecosystem services. They are subject to constant change and increasing demands with respect to the ecosystem services they provide. As well as provision of timber, non-timber forest goods (e.g. berries and mushrooms), clean water, carbon sequestration, and protection against natural disasters, there is increasing emphasis being placed on conservation and promotion of biodiversity within forests. However, the state of biodiversity in European forests varies widely. Because of the different biogeographic, sociocultural, political, and climatic conditions at small scales, there is a wide variety of situations, approaches, and legacies across the continent. This book strives to show the challenges that forest managers are faced with to fulfil the societal demands with regard to forests, and especially to integrate the promotion of biodiversity. In a first section (12 chapters), 44 authors from science, policy, and practice describe the driving factors of forest management; these factors include national laws and legacies, ownership structures, forest history, and socio-structural conditions. In a second section, 113 authors present 32 case examples from 19 European countries that demonstrate the different approaches to integrate the locally requested ecosystem services. These experiences are synthesised in a final section, and a toolbox of integrative measures is presented that is intended to support forest owners and managers to choose appropriate measures for targeted integrated management in their forests. Copyright reserved WSL and EFI.22 years ago
- ForClim is a cohort-based model that was developed to analyze successional pathways of various forest types in Central Europe. Following the standard approach of gap models ForClim simulates the establishment; growth and mortality of trees on multiple independent patches (typically n = 200) in annual time steps to derive regional-scale stand dynamics. ForClim is currently parameterized for ca. 180 tree species dominant of temperate forests worldwide. The model has been tested comprehensively for the representation of natural forest dynamics of temperate forests of the Northern Hemisphere, with an emphasis on European forests. ForClim may be freely used under the terms of the "GNU GENERAL PUBLIC LICENSE v3" license. 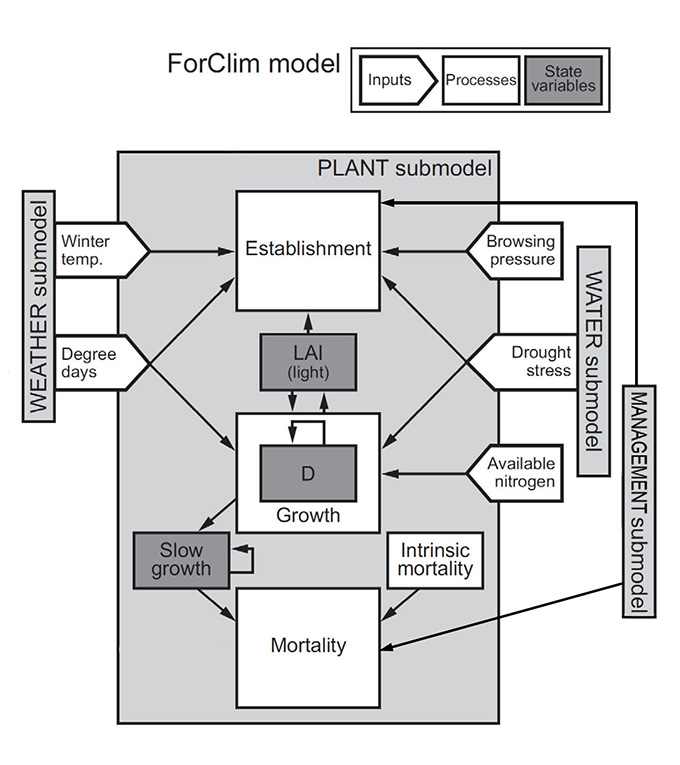22 years ago
- 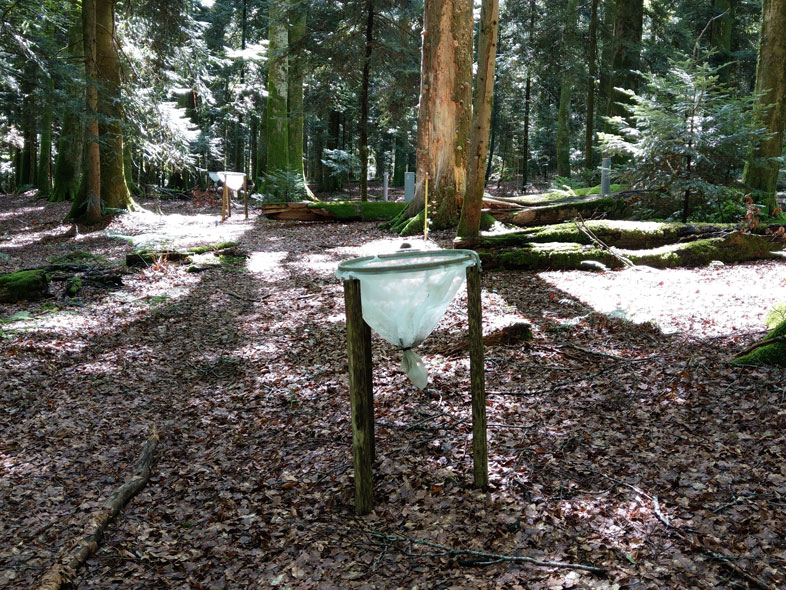 LWF Plot Lausanne - Community: Lausanne / canton VD - Date of installation: 5 September 1994 - Size of the plot: 2 ha - Altitude: 800-814 m - Mean slope: 7% - Geology (in German): Untergrund: Tertiär, Miozän, Burdigalien, obere Meeresmolasse; Sandstein - Oberfläche: Quartär, Würm; würmeiszeitliche Moräne - Soil types (WSL) : Distric Cambisols - Woodland association after EK72: 8: Milio-Fagetum - Main tree species: Fagus sylvatica - Management system: high forest - Silvicultural system: group selection - Top-height diameter (quadratic average diameter of the 100 thickest trees per ha): 59.9 cm - Number of trees BHD >= 12 cm (2011): 650 - Maximum tree age: Abies alba 160-170 yr - Picea abies 160-170 yr - Fagus sylvatica 160-170 yr More Information: https://www.wsl.ch/en/forest/forest-development-and-monitoring/long-term-forest-ecosystem-research-lwf/sites/lausanne.html22 years ago
- Carabidae data from all historic up to the recent projects (21.10.2019) of WSL, collected with various methods in forests of different types. Version 2 ('FIDO_global_extract 2019-11-22_18-11-24 WSL-Forest-Carabidae') contains additional data field PROJ_FALLENBEZEICHNUNG. Data are provided on request to contact person against bilateral agreement.42 years ago
- This database contains GNSS derived snow water equivalent (SWE), liquid water content (LWC), and snow height (HS) and reference data collected during the two winter 2018-2020 at 4 sites Weissfluhjoch (2540 m asl, 46°49’47’’ N, 9°48’34’’E), Laret (1515 m asl, . 46°50’2’’N, 9°52’17’’E), Klosters (1200 m asl, 46°51’49’’N, 9°53’17’’E), and Küblis (815 m asl, 46°54’48’’N, 9°46’54’’E).212 years ago
-  LWF Plot Lantsch - Community: Lantsch / canton GR - Date of installation: 15 September 1997 - Size of the plot: n.d. - Altitude: 1458-1490 m - Mean slope: 16% - Geology (in German): Ostalpin. Gehängeschutt aus mesozoischen Schiefern, Dolomiten und Kalken - Soil types (WSL) : n.d. - Woodland association after EK72: 65: Erico-Pinetum silvestris - Main tree species: Picea abies - Management system: high forest - Top-height diameter (quadratic average diameter of the 100 thickest trees per ha): 40.1 cm - Number of trees BHD >= 12 cm (2011): 709 - Maximum tree age: n.d. More Information: https://www.wsl.ch/en/forest/forest-development-and-monitoring/long-term-forest-ecosystem-research-lwf/sites/lantsch.html12 years ago
- High-resolution information on climatic conditions is essential to many applications in environmental and ecological sciences. Here we present downscaled climate data for the CORDEX EUR11 domain at a high resolution of 30 arc sec. The temperature algorithm is based on statistical downscaling of atmospheric temperature lapse rates. The precipitation algorithm incorporates orographic predictors including wind fields, valley exposition, and boundary layer height. The resulting data consist of a daily temperature and precipitation timeseries. The data is distributed under a: Creative Commons: Attribution 4.0 International (CC BY 4.0) license.22 years ago
- Quantifying the rates of soil redistribution worldwide poses a significant challenge, which has been addressed using various methods such as direct sediment measurements, models, and the use of isotopic, geochemical, and radionuclide tracers. Among these tracers, the isotope of Plutonium, specifically 239+240Pu, is a relatively recent addition to the study of soil redistribution. However, there is still a lack of direct validation for 239+240Pu as a tracer for soil redistribution. To address this gap, we conducted a study in Southern Italy using a unique sediment yield dataset that extends back to the initial fallout of 239+240Pu. Soil samples were collected from the catchment area as well as undisturbed reference sites, and 239+240Pu was extracted, measured using ICP-MS, and converted into soil redistribution rates.22 years ago
- Mircocosm experiment to identify the individual patterns and controls of C, N, and P mobilization in soils under beech forests. Organic and mineral horizons sampled along a nutrient availability gradient in Germany were exposed to either permanent moist conditions or to dry spells in microcosms and quantified the release of inorganic and organic C, N, and P.22 years ago
- Data set consisting of snow climate indicators derived from parallel manual snow measurements in Switzerland.32 years ago
- Based on the detailed tree stump inventory implemented in the Swiss NFI5 (https://www.lfi.ch/lfi/lfi.php), a study was conducted to obtain an accurate assessment of the stumps pool in the Swiss NFI over the last 30 years and to identify its significance for the total dead wood (DW) pool. The NFI5 includes a detailed stump inventory to improve accuracy and completeness of the above-ground DW- pool. Based on available data, stump volume estimates were derived at different accuracies to evaluate the contribution to the total DW-pool over time. The study found that in Swiss Forests the contribution of stumps to total DW-pool is approximately 25%, and that applying simplifying assumptions to estimate stump volume can result in a significant underestimation of the true size of this pool. This study demonstrates that stumps can be a significant proportion of DW in forests, which should be accounted for in order to improve accuracy and completeness of NFI estimates and derived data such as C stocks for greenhouse gas reporting. The study is published in Annals of Forest Science (2022) 79:34, https://doi.org/10.1186/s13595-022-01155-7 (open access). The data can be obtained from the authors upon reasonable request.102 years ago
- Static input data (topography, landuse and soiltype) for the WRF preprocessing system WPS is provided for Switzerland and its neighboring countries between 45-49 N and 4-12 E. The data is provided at a resolution of 1 s. Topography is based on the Aster dataset, while landuse is extracted from the Corine landuse dataset. Soil type is set to silty clay loam for the entire domain. This static input data is valid for WRF and CRYOWRF.72 years ago
- This dataset contains all data, on which the following publication below is based. __Paper Citation:__ _Resch, M.C., Schütz, M., Ochoa-Hueso, R., Buchmann, N., Frey, B., Graf, U., van der Putten, W.H., Zimmermann, S., Risch, A.C. (in review). Long-term recovery of above- and belowground interactions in restored grassland after topsoil removal and seed addition. Journal of Applied Ecology_ __Please cite this paper together with the citation for the datafile.__ Study area and experimental design The study was conducted in and around two nature reserves, Eigental and Altläufe der Glatt, which were located approximately 5 km apart (47°27´ to 47°29´ N, 8°37´ to 8°32´ E, 417 to 572 m a.s.l., Canton of Zurich, Switzerland; Figure S1 and S2, Table S1). Mean annual temperature and precipitation are 9.8 ± 0.6 °C and 990 ± 168 mm (Kloten climate station 1988-2018; MeteoSchweiz, 2019). TFor this study, we used a space-for-time approach based on eight restoration sites that were between 3 and 32 years old. We measured recovery and restoration success by comparing the restored grasslands with intensively managed and semi-natural grasslands. Using a space-for-time approach requires high similarities in historical properties of the site, such as soil conditions and management regimes, to assure that temporal processes are appropriately represented by spatial patterns (Walker et al., 2010). This was the case in our study. The restored sites had similar soil conditions (i.e., soil type, structure, water availability) as the targeted semi-natural grasslands, while they shared the same agricultural legacy with intensively managed grasslands, i.e., biomass harvest and fertilization (manure and/or slurry) three to five times a year as well as tillage. We randomly established three 5 m x 5 m (25-m2) plots for plant identification and three 2 m x 2 m (4-m2) subplots for soil biotic and abiotic data collection at least 2 m away from the 25-m2 plots in each restoration site. Sites of similar age were grouped into four age classes: Y.4 (3 & 4 years after restoration), Y.18 (17 & 19 years), Y.24 (23 & 25 years), and Y.30 (27 & 32 years). Six intensively managed (Initial) and six semi-natural grassland (Target) sites complemented the experimental set-up, for a total of 36 plots. All plots were sampled under similar conditions, i.e., day of the year, air temperature, soil moisture, and time since last rain event, in June/July 2017 (intensively managed and semi-natural plots) and 2018 (restored plots). Collection of plants and selected soil biota data Plant species cover (in %) was visually estimated in each 25-m2 plot in mid-June (Braun-Blanquet, 1964; nomenclature: Lauber & Wagner, 1996). We calculated Shannon diversity and assessed plant community structure. We included soil microbial (fungi, procaryotes) and nematodes in our study as they represent the majority of soil biotic diversity and abundance (Bardgett & van der Putten, 2014), cover various trophic levels of the soil food web (Bongers & Ferris, 1999), and play key roles in soil functioning and ecosystem processes (Bardgett & van der Putten, 2014). In particular, soil nematodes were found to be well suited belowground indicators to evaluate recovery/development after restoration (e.g. Frouz, et al. 2008; Kardol et al., 2009; Resch et al., 2019). We randomly collected ten soil cores (2.2 cm diameter x 12 cm depths; sampler from Giddings Machine Company, Windsor, USA) in the 4-m2 subplots to assess soil nematode and microbial (fungal, prokaryotic) diversities and community structures. For soil nematodes, eight of the soil cores were combined and gently homogenized, placed in coolers and stored at 4 °C and transported to the laboratory (Netherlands Institute of Ecology, NIOO, Wageningen, Netherlands) within three days after collection. Free-living nematodes were extracted from 200 g of fresh soil using Oostenbrink elutriators (Oostenbrink, 1960). After extraction, each sample was divided into three subsamples, two for molecular identification and one to determine nematode abundance (see Resch et al., 2019). For the molecular work, two subsamples were stored in 70% ethanol (final volume 10 mL each) and transported to the laboratory at the Swiss Federal Research Institute WSL (Birmensdorf, Switzerland). Each subsample was reduced to roughly 200 μL by centrifugation and removal of the supernatant. The remaining ethanol was vaporized (65 °C for 3 h). Thereafter, 180 μL ATL buffer solution (Qiagen, Hilden, Germany) was immediately added and samples were stored at 4 °C until further processing. From these samples, nematode metagenomic DNA was extracted using the DNeasy Blood & Tissue Kit (Qiagen, Hilden, Germany) according to the manufacturer`s protocol, except for the incubation step which was run at 56 °C for 4 h. PCR amplification of the V6-V8 region of the eukaryotic small-subunit (18S) was performed with 7.5 μL of genomic DNA template (ca. 1 ng/μL) in 25 μL reactions containing 5 μL PCR reaction buffer, 2.5 mM MgCL2, 0.2 mM dNTPs, 0.8 μM of each primer (NemF: Sapkota & Nicolaisen, 2015; 18Sr2b: Porazinska et al., 2009), 0.5 μL BSA, and 0.25 μL GoTaq G2 Hot Start Polymerase (Promega Corporation, Madison, USA). Amplification was using an initial DNA denaturation step of 95 °C for 2 min, followed by 35 cycles at 94 °C for 40 sec, 58 °C for 40 sec, 72 °C for 1 min, and a final elongation step at 72 °C for 10 min. Filtering, dereplication, sample inference, chimera identification, and merging of paired-end reads was implemented using the DADA2 pipeline (v.1.12; Callahan et al., 2016) to finally assign amplicon sequence variants (ASVs) as taxonomic units. We combined and homogenized the remaining two soil cores to assess soil microbes, placed them in coolers (4 °C) and transported them to the laboratory at WSL. Metagenomic DNA was extracted from 8 g sieved soil (2 mm) using the DNAeasy PowerMax Soil Kit (Qiagen, Hilden, Germany) according to the manufacturer´s protocol. PCR amplification of the V3-V4 region of the small-subunit (16S) of prokaryotes (i.e., bacteria and archaea) and the ribosomal internal transcribed spacer region (ITS2) of fungi was performed with 1 ng of template DNA using PCR primers and conditions as previously described (Frey et al., 2016). PCRs were run in triplicates, pooled and sent to the Genome Quebec Innovation Centre (Montreal, QC, Canada) for barcoding using the Fluidigm Access Array technology (Fluidigm) and paired-end sequencing on the Illumina MiSeq v3 platform (Illumina Inc., San Diego, USA). Quality filtering, clustering into operational taxonomic units (OTUs, 97% similarity cutoffs) and taxonomic assignment were performed as previously described (Resch et al., 2021).Taxonomic classification of nematode, prokaryotic and fungal sequences was conducted querying against the most recent versions of PR2 (v.4.11.1; Guillou et al., 2013), SILVA (v.132; Quast et al., 2013), and UNITE (v.8; Nilsson et al., 2019) reference sequence databases. Taxonomic assignment cutoffs were set to confidence rankings ≥ 0.8 (below ranked as unclassified). Prokaryotic OTUs assigned to mitochondria or chloroplasts as well as OTUs or ASVs assigned to other than Fungi or Nematoda were manually removed prior to data analysis. The three datasets were filtered to discard singletons and doubletons. Taxonomic abundance matrices were rarefied to the lowest number of sequences per community to achieve parity of the total number of reads between samples (Prokaryotes: 10,929 reads; Fungi: 18,337 reads; Nematodes: 6,662 reads). We calculated Shannon diversity and assessed community structures for soil nematodes, prokaryotes and fungi based on their relative abundances of ASV or OTU at the taxon level. Collection of soil physical and chemical properties We randomly collected one undisturbed soil core (5 cm diameter, 12 cm depth) per 4-m2 subplot using a steel cylinder that fit into the soil corer. The cylinders were capped to avoid disturbance during transport and used to measure field capacity, rock content and fine earth density as previously described (Resch et al., 2021). We randomly collected another three soil cores (5 cm diameter, 12 cm depths) in each 4-m2 subplot to determine soil chemical properties. The cores were pooled, dried at 60 °C for 48 h and passed through a 2 mm sieve. We measured soil pH (CaCl2) on dried samples, total nitrogen (N) and organic carbon (C) concentration on dried and fine-ground samples (≤ 0.5 mm; for details see Resch et al., 2021). We calculated total N and organic C pools after correcting its concentration for soil depth, rock content and fine earth density.72 years ago
- CHELSAcruts is a delta change monthly climate dataset for the years 1901-2016 for mean monthly maximum temperatures, mean monthly minimum temperatures, and monthly precipitation sum. Here we use the delta change method by B-spline interpolation of anomalies (deltas) of the CRU TS 4.01 dataset. Anomalies were interpolated between all CRU TS grid cells and are then added (for temperature variables) or multiplied (in case of precipitation) to high resolution climate data from CHELSA V1.2 (Karger et al. 2017, Scientific Data). This method has the assumption that climate only varies on the scale of the coarser (CRU TS) dataset, and the spatial pattern (from CHELSA) is consistent over time. This is certainly a rather crude assumption, and for time periods for which more accurate data is available CHELSAcruts should be avoided if possible (e.g. use CHELSA V1.2 for 1979-2015). Different to CHELSA V1.2, CHELSAcruts does not take changing wind patterns, or temperature lapse rates into account, but rather expects them to be constant over time, and similar to the long term averages. CHELSAcruts is licensed under a Creative Commons Attribution 2.0 Generic (CC BY 2.0) license.22 years ago
- Data set consists of monthly mean values for snow depth and days with snow on the ground intended for the use of break detection with ACMANT, Climatol and HOMER. List and coordinates of stations used as well as metadata and break detection results from all three methods is included. ## Columns Monthly means for each hydrological year: Nov, Dec, Jan, Feb, Mar, Apr with May to Oct set to zero92 years ago
- The Intercantonal Measurement and Information System (IMIS) consists of nearly 200 automatic measuring stations. They are distributed throughout the Swiss Alps and the Jura region and, in most cases, are situated above the tree line, most frequently between 2000 and 3000 m. The stations record the conditions around the clock, in general every 30 minutes. Most IMIS stations are located in the vicinity of starting zones of potentially destructive avalanches, and provide essential information to local safety officers for public safety in settlements and on the roads. They are also used for snow-hydrological and research purposes and by the avalanche warning service of the SLF. This dataset comprises data from IMIS snow and wind stations. The snow and wind stations are usually situated close to each other and measure the key weather data required for assessing the avalanche danger. ## IMIS snow stations Snow stations are located on wind-protected flat terrain. The snowpack model SNOWPACK calculates the layers and properties of the snowpack throughout the winter for each of the IMIS snow stations. The following variables are measured or simulated in the standard programme of IMIS snow stations and are available in this dataset: - Snow depth - 24-hour new snow (SNOWPACK simulation) - Air and surface temperature - Wind speed and direction - Relative humidity - Reflected shortwave radiation - Ground temperature - Snow temperature 25 cm, 50 cm and 100 cm above the ground ## IMIS wind stations Wind stations are generally situated at higher altitudes on exposed summits or ridges. The following variables are measured in the standard programme of IMIS wind stations and are available in this dataset: - Wind speed and direction - Air temperature - Relative humidity __When using the data, please consider and adhere to the associated [Terms of Use](https://www.slf.ch/en/services-and-products/data-and-monitoring/slf-data-service.html)__. __To download live data use our [API](https://measurement-api.slf.ch)__. __To download data older than 7 days use our [File Download](https://measurement-data.slf.ch)__.32 years ago
- This study documents the development of a semi-distributed hydrological model aimed at reflecting the dominant controls on observed streamflow spatial variability. The process is presented through the case study of the Thur catchment (Switzerland, 1702 km2), an alpine and pre–alpine catchment where streamflow (measured at 10 subcatchments) has different spatial characteristics in terms of amounts, seasonal patterns, and dominance of baseflow. In order to appraise the dominant controls on streamflow spatial variability, and build a model that reflects them, we follow a two–stages approach. In a first stage, we identify the main climatic or landscape properties that control the spatial variability of streamflow signatures. This stage is based on correlation analysis, complemented by expert judgment to identify the most plausible cause-effect relationships. In a second stage, the results of the previous analysis are used to develop a set of model experiments aimed at determining an appropriate model representation of the Thur catchment. These experiments confirm that only a hydrological model that accounts for the heterogeneity of precipitation, snow related processes, and landscape features such as geology, produces hydrographs that have signatures similar to the observed ones. This model provides consistent results in space–time validation, which is promising for predictions in ungauged basins. The presented methodology for model building can be transferred to other case studies, since the data used in this work (meteorological variables, streamflow, morphology and geology maps) is available in numerous regions around the globe.22 years ago
- ## Introduction The ZIP file contains all data and code to replicate the analyses reported in the following paper. Reber, U., Fischer, M., Ingold, K., Kienast, F., Hersperger, A. M., Grütter, R., & Benz, R. (2022). Integrating biodiversity: A longitudinal and cross-sectoral analysis of Swiss politics. *Policy Sciences*. [https://doi.org/10.1007/s11077-022-09456-4](https://doi.org/10.1007/s11077-022-09456-4) If you use any of the material included in this repository, please refer to the paper. If you use (parts of) the text corpus, please also refer to the sources used for its compilation listed below. The content of the texts may not be changed. ## Data folder The data folder contains the following files. * _corpus.parquet_: Text corpus of Swiss policy documents * _dict_de.csv_: Biodiversity dictionary (German) * _dict_fr.csv_: Biodiversity dictionary (French) * _dict_it.csv_: Biodiversity dictionary (Italian) * _topic_labels.csv_: labels/codes for policy sectors * _topics.csv_: labels/codes for policy sectors The corpus and the dictionary were compiled by the authors specifically for this project. The labels/codes for policy sectors are based on the [coding scheme](http://ws-old.parlament.ch/affairs/topics) of the Swiss Parliament. ### Text corpus The text corpus consists of 439,984 Swiss policy documents in German, French, and Italian from 1999 to 2018. The corpus was compiled from the following source between 2020-10-01 and 2021-01-31. * Transcripts and parliamentary businesses (e.g. questions, motions, parliamentary initiatives) via the [Web Services (WS)](https://www.parlament.ch/de/%C3%BCber-das-parlament/fakten-und-zahlen/open-data-web-services) provided by the Swiss Parliament * The official compilation of federal legislation ("Amtliche Sammlung", AS) via [opendata.swiss](https://opendata.swiss/de/dataset/official-compilation-of-federal-legislation-bs-as-1947-2018) provided by the Swiss Federal Archives (SFA) * The federal gazette ("Bundesblatt") via [fedlex.admin.ch](https://www.fedlex.admin.ch/de/fga/index) * Decisions of federal courts via [entscheidsuche.ch (ES)](https://entscheidsuche.ch/) The corpus is stored in a single data frame to use with R saved as [PARQUET](https://parquet.apache.org/) file (corpus.parquet). The data frame has the following structure. * _text_id_: Unique identifier for each text (source information as prefix, e.g. "t_") * _doc_type_: Document type (see coding scheme below) * _branch_: Government branche (1 legislative, 2 executive, 3 judicative) * _stage_: Stage of policy process (1 drafting, 2 introduction, 3 interpretation) * _year_: Year of publication * _topic_: Policy sector (coding scheme in separate file in data folder) * _lang_: Language (de, fr, it) * _text_: Text The following list contains the coding scheme for the doc_type variable. * 101: Federal gazette // Draft for public consultation ("Vernehmlassungsverfahren") * 102: Federal gazette // Explanation of draft for parliament ("Botschaft") * 103: Federal gazette // Strategy, action plan * 104: Federal gazette // Federal council decree ("Bundesratsbeschluss") * 105: Federal gazette // (Simple) Federal decree ("(Einfacher) Bundesbeschluss") * 106: Federal gazette // General decree ("Allgemeinverfügung") * 107: Federal gazette // Treaty ("Übereinkommen") * 108: Federal gazette // Treaty ("Abkommen") * 109: Federal gazette // Draft for parliament ("Entwurf") * 110: Federal gazette // Report ("Bericht") * 111: Federal gazette // Report of parliamentary comission ("Bericht") * 112: Federal gazette // Report of federal council ("Bericht") * 201: Parl. businesses // Submitted text * 202: Parl. businesses // Reason text * 203: Parl. businesses // Federal council response * 204: Parl. businesses // Initial situation * 205: Parl. businesses // Proceedings * 301: Parl. transcripts // Speech of MP * 302: Parl. transcripts // Speech of federal council * 401: Federal legislation // Legal text of the official compilation (law, ordinances, etc.) * 501: Court decisions // Federal Supreme Court * 502: Court decisions // Federal Criminal Court * 503: Court decisions // Federal Administrative Court ## Code folder The code folder contains all R code for the analyses. The files are numbered chronologically. * _1_classifier_training.R_: Training of classifiers for classification of policy sectors * _2_classifier_application.R_: Classification of documents in corpus * _3_dictionary_application.R_: Biodiversity indexing of documents in corpus * _4_stm_truncation.R_: Truncation of indexed documents to keep only relevant parts * _5_stm_translation.R_: Translation of FR and IT documents to DE * _6_stm_model.R_: Preprocesssing and structural topic model * _7_plots.R_: Plots and numbers as included in the paper The code/functions folder contains custom functions used in the scripts, e.g. to support topic model interpretation. Package versions and setup details are noted in the code files. ## Contact Please direct any questions to Ueli Reber (ueli.reber@eawag.ch).12 years ago
- Incoming and outgoing shortwave and longwave 2 min radiation measurements at the Weissfluhjoch research site, Davos, CH. The experimental site at the Weissfluhjoch (WFJ, 46.83 N, 9.81 E) is located at an altitude of 2540 m in the Swiss Alps near Davos. During the winter months, almost all precipitation falls as snow at this altitude. As a consequence, a continuous seasonal snow cover builds up every winter, with a maximum snow height ranging from 153–366 cm over the period 1934–2012. The measurement site is located in an almost flat part of a southeast oriented slope. ### References 1. Marty, C., Philipona, R., Frohlich, C., Ohmura, A.. Altitude dependence of surface radiation fluxes and cloud forcing in the alps: results from the alpine surface radiation budget network. 2002. Theoretical and Applied Climatology. Volume 72. Issue 3-4. 137-155. http://dx.doi.org/10.1007/s007040200019. 10.1007/s007040200019. 2. Christoph Marty. Surface Radiation, Cloud Forcing and Greenhouse Effect in the Alps. 2000. Institute fuer Klimaforschung ETH. Zuercher Klima-Schriften. Volume 79. http://e-collection.library.ethz.ch/eserv/eth:23491/eth-23491-01.pdf.42 years ago
- # Summary This data set contains Python programming code and modeled data discussed in a related research article. We developed a simple isotope model to study the drivers of the particularly depleted vapour isotopic composition measured on the ship of the Antarctic Circumnavigation Expedition close to the outlet of the Mertz glacier, East Antarctica, in the 6-day period from 27 January 2017 to 1 February 2017. The model considers the stable water isotopologues H2(16O), H2(18O), and HD(16O). It uses data from the ERA5 reanalysis product with a spatial resolution of 0.25° x 0.25° (Hersbach et al., 2018) and 10-day backward trajectories for the location of the ship, published by Thurnherr et al. (2020a). Our data set includes the model code, Python scripts for visualizing the results, and data produced by the model including the results shown in the figures of the related research article. Here, we summarize the most important model characteristics while further details can be found in the readme.txt file and the related research article including its supporting information. # Main model characteristics The modeling approach consists of two steps called *Model Sublimation* and *Model Air Parcel*. The former estimates the isotopic compositions of the snow and sublimation flux across the Antarctic Ice Sheet using an Eulerian frame of reference while the latter models the vapour isotopic composition and specific humidity along air parcel trajectories using a Lagrangian frame of reference. The isotope effects of most phase changes are represented by equilibrium fractionation. Only for ocean evaporation, kinetic fractionation is additionally taken into account (original Craig-Gordon formula). For snow sublimation, two assumptions are tested: *Run E* assumes that sublimation is associated with equilibrium fractionation while *Run N* assumes that sublimation occurs without isotopic fractionation. ### Model Sublimation Model Sublimation uses a simple one-dimensional mass-balance approach in each grid cell, considering snow accumulation due to snowfall and vapour deposition and snow ablation due to sublimation. The snowpack is represented by 100 layers of equal thickness (e.g., 1 cm) and density (350 kg m-3). The isotopic composition of snowfall is parameterized by generalizing a site-specific, empirical relationship between the daily mean air temperature and snowfall isotopic composition. In the case of vapour deposition, Model Sublimation assumes equilibrium fractionation and estimates the isotopic composition of the atmospheric vapour as the average value for two idealized situations: (i) locally sourced vapour which has the same isotopic composition as the sublimation flux; (ii) non-locally sourced vapour in isotopic equilibrium with snowfall. Model Sublimation is run with a time step of 1 h, independently of Model Air Parcel. ### Model Air Parcel Every hour, an ensemble of trajectories arrives at different heights in the ABL above the ship. For each of these trajectories, we consider an air parcel with a constant volume of 1 x 1 x 1 m3. The air parcels are initialized at the first suitable time when the trajectories are located in the ABL, either over the ice-free ocean in conditions of evaporation or over snow (Antarctic Ice Sheet or sea ice). Subsequently, the masses of the water isotopologues in the air parcels are simulated with a time step of 3 h, considering vapour uptake or removal due to the moisture flux at the snow or liquid ocean surface (only if the parcel is in the ABL) and cloud/precipitation formation (if the saturation specific humidity is reached). Sea ice is taken into account in a very simplified way. We represent the sea ice by grid cells with a sea-ice cover of more than 90% and assume the isotopic composition of the sublimation flux to be identical to that in the nearest grid cell of the Antarctic Ice Sheet. The isotopic composition of the sublimation flux is taken from Model Sublimation whereas the isotopic composition of the vapour deposition flux (over snow) and condensation flux (over ice-free ocean) is simulated assuming an isotopic equilibrium with the air parcel. Isotope effects of cloud/precipitation formation are represented using the classic Rayleigh distillation model with equilibrium fractionation, where the cloud water is assumed to precipitate immediately after formation. # References Hersbach, H., Bell, B., Berrisford, P., Biavati, G., Horanyi, A., Munoz Sabater, J.,... others (2018). *ERA5 hourly data on single levels from 1979 to present. Copernicus Climate Change Service (C3S) Climate Data Store (CDS)*. doi: 10.24381/cds.bd0915c6 Thurnherr, I., Wernli, H., & Aemisegger, F. (2020a). *10-day backward trajectories from ECMWF analysis data along the ship track of the Antarctic Circumnavigation Expedition in austral summer 2016/2017*. Zenodo. doi: 10.5281/zenodo.403170542 years ago
- snowpackBuoyantPimpleFoam is a two-phase solver implemented to model convection of water vapor with phase change in snowpacks. This new solver is based on the standard solver of buoyantPimpleFoam in the open-source fluid dynamics software, OpenFOAM 5.0 (www.openfoam.org).12 years ago
- This dataset contains the SnowMicroPen (SMP) data from 38 wind tunnel experiments on wind-packing / wind crust formation. These experiments were performed in the winters 2015/16 and 2016/17 and include more than 1000 SMP measurements. The SMPs are organized per experiment. Each experiment subfolder contains the processed SMP profiles and some additional files. Please refer to the README for more details on the data. The processing scripts are available for download as well. The scripts are mainly provided as documentation and would need to be adjusted to be used. This dataset is the basis of the following publication: Sommer C.G., Lehning M., & Fierz C. (2017). Wind tunnel experiments: Saltation is necessary for wind-packing. Journal of Glaciology, 63(242), 950-958. doi:10.1017/jog.2017.5332 years ago
- Dry weight (mass) of branches with a diameter of at least 7 cm from living trees and shrubs starting at 12cm dbh. __Citation:__ > _Abegg, M.; Brändli, U.-B.; Cioldi, F.; Fischer, C.; Herold-Bonardi, A.; Huber M.; Keller, M.; Meile, R.; Rösler, E.; Speich, S.; Traub, B.; Vidondo, B. (2014). Fourth national forest inventory - result tables and maps on the Internet for the NFI 2009-2013 (NFI4b). [Published online 06.11.2014] Available from World Wide Web http://www.lfi.ch/resultate/ Birmensdorf, Swiss Federal Research Institute WSL. [doi:10.21258/1057112](https://doi.org/10.21258/1057112)_22 years ago
- In 2013–2014, a survey was conducted in Switzerland to update the Forest Access Roads geo-dataset within the framework of the Swiss National Forest Inventory (NFI). The resulting nationwide dataset contains valuable information on truck-accessible forest roads that can be used to transport wood. The survey involved interviewing staff from the approximately 800 local forest services in Switzerland and recording the data first on paper maps and then in digitized form. The data in the NFI on the forest roads could thus be updated and additional information regarding their trafficability for specific categories of truck included. The information has now been attached to the geometries of the Roads and Tracks of the swissTLM3D (release 2012) of the Federal Office of Topography swisstopo. The resulting data are suitable for statistical analyses and modeling, but further (labour-intensive) validation work would be necessary if they are to be used as a basis for applications requiring more spatial accuracy, such as navigation systems. The data are managed at the Swiss Federal Institute for Forest, Snow and Landscape Research (WSL) and are available for third parties for non-commercial use provided they have purchased a TLM license. __Related Publication__: [doi: 10.3188/szf.2016.0136](http://dx.doi.org/10.3188/szf.2016.0136)12 years ago
- This dataset includes snow depth, canopy height and terrain elevation maps of forest stands in the Grisons (CH) and at Grand Mesa (CO,USA) derived from airborne lidar. Data were acquired i) within a pilot mission of NASA's Airborne Snow Observatory in the Swiss Alps in March 2017 and ii) during NASA’s SnowEx campaign at Grand Mesa in February 2017. Snow depth maps are available for two dates separated by approx.1 week, and include an area of ca. 0.5km2 for each of the three sites Davos, Engadine and Grand Mesa. All data were presented and analyzed in the publication 'Revisiting Snow Cover Variability and Canopy Structure within Forest Stands: Insights from Airborne Lidar Data' (Mazzotti et al., 2019, WRR, doi: 10.1029/2019WR024898). This publication must be cited when using this dataset. __Paper Citation:__ > _Giulia Mazzotti; William Ryan Currier; Jeffrey S. Deems; Justin M. Pflug; Jessica D. Lundquist; Tobias Jonas (2019). Revisiting Snow Cover Variability and Canopy Structure Within Forest Stands: Insights From Airborne Lidar Data. Water Resources Research, 55, 6198– 6216, [doi: 10.1029/2019WR024898](https://doi.org/10.1029/2019WR024898)._42 years ago
- Continuous measurement of air temperature, relative humidity, wind speed and direction, global radiation, photosynthetic active radiation, UVB radiation, and precipation in an open field very close to the LWF plot as well as air temperature, relative humidity, wind speed, photosynthetic active radiation, and precipitation in the forest below the canopy. ### Purpose: ### Recording meteorological conditions ### Manual Citation: ### * Martine Rebetez, Gustav Schneiter, 1997: Meteorologie. In: Brang P. (ed.) Aufnahmeanleitung LWF. Langfristige Waldökosystem-Forschung LWF, 4 S. * Raspe S, Beuker E, Preuhsler T, Bastrup-Birk A, 2016: Part IX: Meteorological Measurements. In: UNECE ICP Forests Programme Co-ordinating Centre (ed.): Manual on methods and criteria for harmonized sampling, assessment, monitoring and analysis of the effects of air pollution on forests. Thünen Institute of Forest Ecosystems, Eberswalde, Germany, 14 p. + Annex [http://icp-forests.net/page/icp-forests-manual](http://icp-forests.net/page/icp-forests-manual) ### Paper Citation: ### * Martine Rebetez, Georg von Arx, Arthur Gessler, Elisabeth Graf Pannatier, John L. Innes, Peter Jakob, Markéta Jetel, Marlen Kube, Magdalena Nötzli, Marcus Schaub, Maria Schmitt, Flurin Sutter, Anne Thimonier, Peter Waldner, Matthias Haeni, 2018: Meteorological data series from Swiss long-term forest ecosystem research plots since 1997. Annals of Forests Science 75: 41: 1-7. [doi: 10.1007/s13595-018-0709-7](https://doi.org/10.1007/s13595-018-0709-7) * Haeni, Matthias; von Arx, Georg; Gessler, Arthur; Graf Pannatier, Elisabeth; Innes, John L; Jakob, Peter; Jetel, Markéta; Kube, Marlen; Nötzli, Magdalena; Schaub, Marcus; Schmitt, Maria; Sutter, Flurin; Thimonier, Anne; Waldner, Peter; Rebetez, Martine (2016): Long-term forest meteorological data from the Long-term Forest Ecosystem Research Programme (LWF) in Switzerland, from 1996-2016. PANGAEA, [doi: 10.1594/PANGAEA.868390](https://doi.org/10.1594/PANGAEA.868390) * Gustav Schneiter, Peter Jakob, Martine Rebetez, 2004: Sieben Jahre meteorologische Datenerfassung im Schweizer Wald. Infoblatt Forschungsbereich Wald, Vol 17: 4-6 [>>>](https://www.parcs.ch/snp/pdf_public/2011_schneiteretal_datenerf_wald_wsl_2004.pdf) * Jakob P, Sutter F, Waldner P, Schneiter G (2007) Processing remote gauging-data. In: Gomez J. M., Sonnenschein M., Müller M., Welsch H., Rautenstrauch C. (ed.) Information Technologies in Environmental Engineering ITEE 2007, Third International ICSC Symposium, Springer, Berlin, Heidelberg, 211-220.12 years ago
- In the Swiss National Forest Inventory (NFI) the volume of the stem and of large (≥ 7cm in diameter) and small branches is estimated based on allometric functions. These functions were developed based on data collected within the permanent plot network of the Experimental Forest Management (EFM) sites at WSL (David I. Forrester; Hubert Schmid; Jens Nitzsche (2021). The Experimental Forest Management network. EnviDat. doi: 10.16904/envidat.213). The data were converted to digital format in two separate steps in the mid-1970s for stemwood and the mid-1980s for branchwood. The dataset on stemwood volume contains 38’864 single tree data for the mean crosswise diameter at two meter sections along the stem plus an additional measurements at 1.3 m (i.e. DBH) where the diameter is greater than or equal to 7 cm (i.e. threshold of merchantable wood) and the lengths of the stem from the base to the threshold of merchantable wood and to the tree top. The measurements were collected on 768 EFM sites in the period 1888 to 1974. The dataset on branchwood is based on a subset of the stemwood data and contains in the raw format information on 14'712 single trees. It includes aggregated data from the stemwood dataset, i.e. the DBH, the stem-diameter at 7 m from the base, and the tree height from the base to the top, as well as the measured volume of large and small branches. In 2022, the metadata of both datasets were checked, values were examined for plausibility and duplicated entries. Duplicates were removed as far as possible and the branchwood volume data were appended to the stemwood dataset to obtain a final, single file with matching single tree data. Following this evaluation the final dataset consisted of a total of 38’841 trees including 14’038 trees with measured branchwood data.22 years ago
- The first EVOLTREE Conference, taking place in hybrid format (on-site and online) at WSL Birmensdorf (Switzerland) from 14-17 September, 2021, focuses on the genomics of trees and interacting species from evolutionary, demographic, and ecological perspectives. EVOLTREE is a European network of institutions engaged in studying the evolution and functioning of forest ecosystems, in particular trees as the foundation species in forest stands. A prime topic in the face of ongoing climate change is to elucidate how trees, together with their associated organisms such as mycorrhizal fungi, respond to rapid environmental changes. The conference includes contributions that apply innovative approaches and consider the relevance of their research in the context of biodiversity conservation through natural dynamics or silvicultural interference.12 years ago
- Measurement of the soil water availability to plants at 10 LWF plots every 14 days in 5 soil depths (15, 30, 50, 80, 130 cm) with 8 replicates (usually in the IM plot). The range of measurement is from water saturation until-80 kPa. ### Purpose: ### The long-term measurement of the soil water availability to plants in the root zone provides useful information about the soil moisture conditions (drought, water saturation, water easily available to plants). The measurement of the soil water suction allows to calibrate the water balance models and to validate the modelled matric potential. ### Manual Citation: ### * Peter Waldispühl, 1997: Installation von Tensiometern auf LWF-Flächen. Langfristige Waldökosystem-Forschung LWF, Birmensdorf, 2 S. * Peter Waldispühl, Andreas Rigling, 1997: Vorgehen bei der Ablesung von Teniometern auf LWF-Flächen. Langfristige Waldökosystem-Forschung LWF, Eidg. Forschungsanstalt WSL, Birmensdorf, 2 S. * Peter Waldispühl, 2000: Kurzanleitung für die TensioDB. Langfristige Waldökosystem-Forschung, Eidg. Forschungsanstalt WSL, Birmensdorf, 12 S. + DB-Schema ### Paper Citation: ### * Graf Pannatier, E.; Thimonier, A.; Schmitt, M.; Walthert, L.; Waldner, P., 2011: A decade of monitoring at Swiss Long-Term Forest Ecosystem Research (LWF) sites: can we observe trends in atmospheric acid deposition and in soil solution acidity?. Environmental Monitoring and Assessment, 174, 1-4: 3-30. [doi: 10.1007/s10661-010-1754-3](http://doi.org/10.1007/s10661-010-1754-3)12 years ago
- In order to digitally plan a cable line using the QGIS plugin ‘Seilaplan’, maps with various background information are helpful. In this tutorial we show you how to obtain maps that are helpful for cable line planning, for example a national map of Switzerland at different scales, the NFI vegetation height model or the NFI forest mix rate. For this we explain what WMS datasets are and how to integrate them into QGIS. No download of large data is needed for this, only a good internet connection. Please note that the tutorial language is German! Link for the integration of WMS data: https://wms.geo.admin.ch/ Link to the description on the Swisstopo website: https://www.geo.admin.ch/en/geo-services/geo-services/portrayal-services-web-mapping/web-map-services-wms.html Link to the Seilaplan website: https://seilaplan.wsl.ch ************************** Für die Verwendung des QGIS Plugins Seilaplan zur digitalen Seillinienplanung sind verschiedene Hintergrundkarten hilfreich. In diesem Tutorialvideo zeigen wir, was WMS Daten sind und wie man diese in QGIS einbinden kann. Dafür müssen die Daten nicht heruntergeladen werden. Es braucht lediglich eine gute Internetverbindung. Für die Seillinienplanung hilfreiche Karten sind bspw. die Landeskarte der Schweiz in verschiedenen Massstäben, das Vegetationshöhenmodell LFI oder der Waldmischungsgrad LFI. Link zur Einbindung der WMS Daten: https://wms.geo.admin.ch/ Link zur Beschreibung auf der Swisstopo Webseite: https://www.geo.admin.ch/de/geo-dienstleistungen/geodienste/darstellungsdienste-webmapping-webgis-anwendungen/web-map-services-wms.html Link zur Seilaplan-Website: https://seilaplan.wsl.ch22 years ago
- Scolytidae data from all historic up to the recent projects (29.10.2019) of WSL, collected with various methods in forests of different types. Data are provided on request to contact person against bilateral agreement.22 years ago
- This repository contains data required for reproducibility of the results to be published in the associated manuscript. Apart from reproducibility, the attached datasets also serve as templates for new users to adopt CRYOWRF in their research. The datasets consist of two folders organized in zip format: 1. REPRODUCIBILITY_SIMULATION: Consists of namelists for WPS, WRF and SNOWPACK to reproduce simulations published in the manuscript Additional files include datasets (from IMAU-FDM / RACMO, see "credits" below ) as well as helper python scripts to produce *.sno files which are used as initial conditions for SNOWPACK in CRYOWRF. 2. REPRODUCIBILITY_POSTPROCESSING: Includes outputs of CRYOWRF and python scripts used to prepare figures in the manuscript. Each of the folders have their own readme files for more details. ### Code citation: Varun Sharma. (2021, July 2). vsharma-next/CRYOWRF: CRYOWRF v1.0 (Version v1.0). Zenodo. http://doi.org/10.5281/zenodo.5060165 location: https://gitlabext.wsl.ch/atmospheric-models/CRYOWRF (stable releases / institutional repo) https://github.com/vsharma-next/CRYOWRF (dev branches / developer repo) ### Publication **Introducing CRYOWRF v1.0: Multiscale atmospheric flow simulations with advanced snow cover modelling.** Varun Sharma, Fraziska Gerber and Michael Lehning, Submitted to Geoscientific Model Development ### Acknowledgements We thank Peter Kuipers Munneke (P.KuipersMunneke@uu.nl) for preparing and sharing outputs of IMAU-FDM and RACMO used for initial conditions for case Ia. The relevant citations for the methods through which these datasets were generated are: * Kuipers Munneke, P., S. R. M. Ligtenberg, B. P. Y. Noël, I. M. Howat, J. E. Box, E. Mosley-Thompson, J. R. McConnell, K. Steffen, J. T. Harper, S. B. Das and M. R. van den Broeke. 2015. Elevation change of the Greenland ice sheet due to surface mass balance and firn processes, 1960-2014. The Cryosphere, 9, 2009-2025. doi:10.5194/tc-9-2009-2015 * Ligtenberg, S. R. M., P. Kuipers Munneke, B. P. Y. Noël, and M. R. van den Broeke. 2018. Brief communication: Improved simulation of the present-day Greenland firn layer (1960-2016). The Cryosphere, 12, doi:10.5194/tc-12-1643-201822 years ago
- Number of stems of all living and dead trees and shrubs starting at 12 cm dbh. __Citation:__ > _Abegg, M.; Brändli, U.-B.; Cioldi, F.; Fischer, C.; Herold-Bonardi, A.; Huber M.; Keller, M.; Meile, R.; Rösler, E.; Speich, S.; Traub, B.; Vidondo, B. (2014). Fourth national forest inventory - result tables and maps on the Internet for the NFI 2009-2013 (NFI4b). [Published online 06.11.2014] Available from World Wide Web http://www.lfi.ch/resultate/ Birmensdorf, Swiss Federal Research Institute WSL. [doi:10.21258/1057112](https://doi.org/10.21258/1057112)_32 years ago
- # Important This EnviDat entry is outdated. The most recent, usable version of the data can be found under the new EnviDat entry "Long-term meteorological station Stillberg, Davos, Switzerland at 2090 m a.s.l.." The entry can be found under this link and with this DOI .82 years ago
- Polygons of wet snow avalanches in the Davos area, as documented by the Swiss avalanche warning service. The georeferenced outlines of the avalanches contain both the release as well as the deposit area, but without separating between both. The dataset is a subset of the total record of 1615 avalanches classified as wet snow avalanches from October 2011 - September 2014, containing those 255 avalanches exceeding 0.0125 km^2. Every polygon comes with meta data, including the date of occurrence. This dataset is the underlying dataset to: Wever, N., Vera Valero, C. and Techel, F. (2018) _Coupled snow cover and avalanche dynamics simulations to evaluate wet snow avalanche activity_. Submitted to J. Geophys. Res., in review.12 years ago
- High quality meteorological data are needed for long-term forest ecosystem research, particularly in the light of global change. The long-term data series published here comprises almost 20 years of measurements for two meteorological stations in Jussy in Switzerland where one station is located within a natural broad-leaved forest stand (JUB) with sessile oak (_Quercus petrea_; 90 yrs), aspen (_Populus tremula_; 60 yrs) and European hornbeam (_Carpinus betulus_; 60 yrs) as dominant tree species. A second station is situated in the very vicinity outside of the forest (field station, JUF). The meteorological time series are presented in hourly time resolution of air temperature, relative humidity, precipitation, photosynthetically active radiation (PAR) and wind speed. Jussy is part of the Long-term Forest Ecosystem Research Programme (LWF) established and maintained by the Swiss Federal Research Institute WSL.72 years ago
- The dataset contains information on precipitation amount and type for Davos Wolfgang (LON: 9.853594, LAT: 46.835577) from February 8 to March 19 2019. It includes: characteristics of hydrometeors (e.g. diameter, fall velocity, amount per diameter class,...), precipitation rate, radar reflectivity, visibility range, weather codes and instrument performance.12 years ago
- **When using this data, please consider and adhere to the associated [Terms of Use](https://www.slf.ch/en/services-and-products/data-and-monitoring/slf-data-service.html)**. This data collection contains information concerning all known accidents by snow avalanches in Switzerland with at least one fatality. The data set commences on 01/10/1936. After the completion of a hydrological year, the new data is added. The following information is provided: * avalanche identifier * date of the accident * accuracy of the date in range of days before and after * hydrological year (always from first of october to end of september) * canton * municipality * start zone point latitude * start zone point longitude * start zone point accuracy (in meters) * start zone point elevation (in meteres above sea level) * slope aspect (main orientation of start zone) * slope inclination (in degree, steepest point within start zone) * forecasted avalanche danger level 1 (first danger) * forecasted avalanche danger level 2 (second danger) * accident within the core zone (most dangerous aspect and elevation as mentioned in the forecast) * number of dead persons * number of caught persons * number of fully buried persons * activity/location of the accident party at the time of the incident12 years ago
- ### Overview The SUNWELL Modelling Environment is a combination of data and code that models electricity production from satellite-derived irradiance data and other spatial data sets for all of Switzerland. This ensemble accompanies the publication "The bright side of PV production in snow-covered mountains", published in the Proceedings of the National Academy of Science and reproduces all results and figures of. Code and resources are in their original form (with documentation). A new version with a more generalized application to PV modelling and with more flexibility in terms of input and output formats will be released in the coming months. ### Format All code is written and has to be executed in Matlab. The input and output data sets are also in the Matlab-specific .mat format. Whenever publicly available, the original data is provided as geotif, .xlsx or other common format. This is the case for: - Digital Elevation Model (InputsFromMatlab/MSG/OriginalData/ASTERDEM), - Landsurface cover type (InputsFromMatlab/MSG/OriginalData/CORINE), - Population Density (InputsFromMatlab/MSG/OriginalData/popdensRaster, - Electricity production from three of our validation sites (/Validation/WSL), - Measured irradiance for two validation sites (/Validation/ASRB) The ‘Metadata’ documents in the respective folders provide further information about the data sources and processing. Figures are produced either in .pdf or .png format. ### Structure The central level of the SUNWELL environment holds the 5 Mains, which run the different modelling aspects of the paper; each code is documented separately. Additional code is located in the __‘DataProcessing’__ and the __‘functions’__ folder. Functions are called in the different Mains. __‘InputsFromMatlab’__ contains the radiation and albedo input data sets in separate subfolders (SIS/SISDIR/ALB). The original data is not publicly available, but can be requested for research purposes free of charge. We provide a processed subset of the data set that was used to run the SUNWELL simulations. The MSG subfolder contains additional spatial input data sets. __‘Outputs’__ contains the output files from the different mains (matching names, Main_CHallpixels.m Prod_CHallpixels) __‘Publication_figures’__ contains all individual figures from the PNAS publication, as well as the generating code (/code_plot) and the power point figures (/ppts) that provide the combined final figures. __‘Validation’__ contains the data sets used in the model validation: - Electricity production from three of our validation sites (/WSL), - Measured irradiance for two validation sites (/ASRB) __Electricity__ production from a validation site at Lac des Toules in Wallis (/LDT), this data set was provided under an NDA and cannot be made publicly available. __Paper Citation:__ > _Annelen Kahl; Jérôme Dujardin; Michael Lehning (2018). Dataset on PV Production in Snow Covered Mountains. PNAS - Proceedings of the National Academy of Sciences. (in press)_22 years ago
- Dataset used to test the potential role of gone-wild grapevines (GWGV) in forests of Southern Switzerland as a source of Flavescence dorée phytoplasma (FDp) inoculum and as a habitat for its main and alternative vectors, Scaphoideus titanus and Orientus ishidae. In the first phase, GWGV were located and sampled to test their FDp status. In addition, a set of chromotropic traps were placed to monitor the presence and abundance of FDp vectors. In the second phase, wood from GWGV in forests was collected and placed in cages to test the potential oviposition activity by FDp vectors. The results showed that GWGV in forests are a reservoir of FDp and that they can sustain the whole life cycle of both S.titanus and O.ishidae. Eventually, the need to adapt the current FD management strategies are highlighted.52 years ago
- This data set consists of incoming and outgoing short- and longwave radiation as well as sunlit-snow-view-fraction as described in the JGR-Atmospheres paper "Shading by trees and fractional snow cover control the sub-canopy radiation budget", by Malle et al. (2019). Data was collected along a 48m long, heterogeneous forest transect between January and June 2018 close to Davos, Switzerland.42 years ago
- MASSIMO is a distance-independent individual-tree simulator that represents demographic processes (regeneration, growth and mortality) with empirical models that have been parameterized with data from the Swiss NFI. Tree regeneration, growth and mortality are simulated on the regular grid of sample plots of the Swiss NFI, which allows for statistically representative simulations of forest development. 12 years ago
- ### One individual per species, vitality class (low and high) and height class (eight classes: 0–10, 11–20, 21–35, 36–60, 61–90, 91–130, 131–200 and 201–500 cm) was randomly selected and harvested in each of the six plots. This resulted in a sample of 82, 80 and 89 living individuals of A. platanoides, A. pseudoplatanus and F. sylvatica, respectively. ### Additionally stems of dead Acer spp. and F. sylvatica trees that had died within the last three years (2015–2018) were randomly harvested, matching the height classes of the harvested living trees wherever possible. In total, 179 dead young trees (60 A. platanoides, 72 A. pseudoplatanus and 47 F. sylvatica) were collected. ## Variables: * species_code: a_pla - Acer platanoides, a_pse - Acer pseudoplatanus, f_syl - Fagus sylvatica * species: as above * dummy: 0 - living individual, 1 - dead individual * LAR_cm2_g: leaf area ratio or ratio of leaf area to total plant biomass, [cm2/g] * tree_age: in years * avg_ring_micron: average width of the last 5 rings in tree life excluding the last ring * dry_mass_g: aboveground and belowground biomass * DLI: direct light index (measured only under living individuals) * BLI: diffuse light index (measured only under living individuals) * GLI: global light index22 years ago
- R data set containing R raster objects with 500m gridded daily modeled soil moisture and net radiation covering Switzerland for the year 2004.22 years ago
- The available datasets are snow depth maps with a spatial resolution of 0.5 m derived from images of the survey camera Vexcel Ultracam mounted on a piloted airplane. Image acquisition was carried out during the approximately peak of winter (time when the thickest snowpack is expected) in spring. The snow depth maps are calculated by the subtraction of a summer-DTM from the processed winter- DSM of the corresponding date. The summer-DTM used was derived from a point cloud of an airborne laser scanner from 2020. Due to the occurrence of inaccuracies of the calculated snow depth values caused by the photogrammetric method, we applied different masks to significantly increase the reliability of the snow depth maps. We masked out settled areas, high-frequented streets and technical constructions, pixels with high vegetation (height > 0.5 m) , outliers and unrealistic snow depth values. In addition, we modified the snow depth values of snow-free pixels to 0. The information on buildings and infrastructure comes from the exactly classified ALS point cloud and the TLM dataset from Swisstopo (https://www.swisstopo.admin.ch/de/geodata/landscape/tlm3d.html#links). High vegetation is also derived from the classification and the calculated object height from the point cloud. Outliers and unrealistic snow depth values are defined as negative snow depth values and snow depths exceeding 10 m. The classification of each pixel of the corresponding orthophoto into snow-covered or snow-free is based on the application of a threshold of the NDSI or manually determined ratios of the RGB values. An extensive accuracy assessment proves the high accuracy of the snow depth maps with a root mean square error of 0.25 m for the year 2017 and 0.15 m for the following snow depth maps. The work is published in:12 years ago
-  LWF Plot Bettlachstock - Community: Bettlachstock / canton SO - Date of installation: 6 June 1995 - Size of the plot: 1.28 ha - Altitude: 1101-1196 m - Mean slope: 66% - Geology (in German): Kettenjura; Jura: Dogger, oberer Hauptrogenstein - Soil types (WSL) : Rendzic Leptosols; Calcaric Cambisols - Woodland association after EK72: 13 h: Cardamino-Fagetum tilietosum - Main tree species: Fagus sylvatica - Management system: high forest - Silvicultural system: forest reserve - Top-height diameter (quadratic average diameter of the 100 thickest trees per ha): 49.5 cm - Number of trees BHD >= 12 cm (2011): 632 - Maximum tree age: Fagus sylvatica 170-190 yr - Picea abies 200 yr - Fraxinus excelsior 170 yr - Ulmus glabra 160 yr - Abies alba 190 yr More Information: https://www.wsl.ch/en/forest/forest-development-and-monitoring/long-term-forest-ecosystem-research-lwf/sites/bettlachstock.html22 years ago
- High quality meteorological data are needed for long-term forest ecosystem research, particularly in the light of global change. The long-term data series published here comprises almost 20 years of measurements for two meteorological stations in Nationalpark in Switzerland where one station is located within a natural coniferous forest stand (NAB) with mountain pine (_Pinus mugo_; 210 yrs) as dominant tree species. A second station is situated in the very vicinity outside of the forest (field station, NAF). The meteorological time series are presented in hourly time resolution of air temperature, relative humidity, precipitation, photosynthetically active radiation (PAR) and wind speed. Nationalpark is part of the Long-term Forest Ecosystem Research Programme (LWF) established and maintained by the Swiss Federal Research Institute WSL.72 years ago
- Individual genotypes assessed at six nuclear microsatellite loci (two alleles per locus) for individuals of the butterfly Melanargia galathea (Marbled white) that were collected throughout Switzerland, along the regular grid of the Biodiversity Monitoring (BDM) of Switzerland. For each individual, the sampling site (number) and the genotype are given. Note that due to privacy restrictions, the original geographic coordinates remain disclosed. For original coordinates, data holders should be contacted (Swiss Federal Office for the Environment; Biodiversity Monitoring Switzerland). The data refer to the following publication: Terzer et al., Distinct spatial patterns of genetic structure and diversity in the butterfly Marbled White (Melanargia galathea) inhabiting fragmented grasslands. Conservation Genetics, https://doi.org/0.1007/s10592-023-01593-4.12 years ago
- Number of forest sample plots (Plots). __Citation:__ > _Abegg, M.; Brändli, U.-B.; Cioldi, F.; Fischer, C.; Herold-Bonardi, A.; Huber M.; Keller, M.; Meile, R.; Rösler, E.; Speich, S.; Traub, B.; Vidondo, B. (2014). Fourth national forest inventory - result tables and maps on the Internet for the NFI 2009-2013 (NFI4b). [Published online 06.11.2014] Available from World Wide Web http://www.lfi.ch/resultate/ Birmensdorf, Swiss Federal Research Institute WSL. [doi:10.21258/1057112](https://doi.org/10.21258/1057112)_42 years ago
- The reaction of ozone with bromide in polar regions results in the formation of reactive bromide species with impacts on ozone budget and the oxidative capacity of the lower atmosphere. Here, we present a data investigating the temperature dependence of bromide oxidation by ozone using a coated wall flow tube reactor coated with an aqueous mixture of citric acid and sodium bromide, a proxy for sea salt aerosol in snow or the free troposphere. Thus study shows the effect of of organic species at relatively mild temperatures between the freezing point and eutectic temperature as typical for Earth's cryosphere.22 years ago
- Complete extract of Fauna Database of WSL, containing all projects and all taxa. Meant as exchange and citation platform for sharing the data with the national data centre 'Centre Suisse de la Cartographie de la Fauna (CSCF)', and Info Fauna.32 years ago
- This is the simulation dataset from _"Response of snow cover and runoff to climate change in high Alpine catchments of Eastern Switzerland"_, M. Bavay, T. Grünewald, M. Lehning, Advances in Water Resources __55__, 4-16, 2013 A model study on the impact of climate change on snow cover and runoff has been conducted for the Swiss Canton of Graubünden. The model Alpine3D has been forced with the data from 35 Automatic Weather Stations in order to investigate snow and runoff dynamics for the current climate. The data set has then been modified to reflect climate change as predicted for the 2021-2050 and 2070-2095 periods from an ensemble of regional climate models. The predicted changes in snow cover will be moderate for 2021-2050 and become drastic in the second half of the century. Towards the end of the century the snow cover changes will roughly be equivalent to an elevation shift of 800 m. Seasonal snow water equivalents will decrease by one to two thirds and snow seasons will be shortened by five to nine weeks in 2095. Small, higher elevation catchments will show more winter runoff, earlier spring melt peaks and reduced summer runoff. Where glacierized areas exist, the transitional increase in glacier melt will initially offset losses from snow melt. Larger catchments, which reach lower elevations will show much smaller changes since they are already dominated by summer precipitation.22 years ago
- snowBedFoam 1.0. is a snow transport solver implemented in the Computational Fluid Dynamics (CFD) software OpenFOAM. It is adapted from the standard multi-phase flow solver DPMFoam for application in snow-influenced environments. To simulate aeolian snow transport, snowBedFoam 1.0. handles coupled Eulerian–Lagrangian phases, which involve a finite number of particles (snow) spread in a continuous phase (air). The snow erosion and deposition are modelled through physically-based equations such as the ones employed in the well-established LES-Lagrangian Stochastic Model (Comola and Lehning, 2017 ; Sharma et al., 2018). This modelling approach is computationally intensive and thus adapted to simulate snow movement and distribution on small scale terrain. snowBedFoam 1.0. was tested against topographical data collected on Arctic sea ice during the MOSAiC expedition (Clemens-Sewall, 2021) . Together with atmospheric data from the MOSAiC Met City (Shupe et al., 2021) used for the fluid forcing, the model was able to accurately simulate the zones of erosion and deposition of snow along a complex ice ridge structure. The core code of snowBedFoam 1.0. is also accessible on the WSL/SLF GitLab repository (more details in the Resources section).32 years ago
- Continuous measurement of soil water content at one control and in one irrigated plot in 10, 40 and 60 cm depth (4 replications) with TDR (Tektronix 1502B cable tester, Beaverton, OR, US). ### Purpose: ### Monitoring of the soil water content ### Paper Citation: ### * Dobbertin, M.; Eilmann, B.; Bleuler, P.; Giuggiola, A.; Graf Pannatier, E.; Landolt, W.; Schleppi, P.; Rigling, A., 2010: Effect of irrigation on needle morphology, shoot and stem growth in a drought-exposed Pinus sylvestris forest. Tree Physiology, 30, 3: 346-360. [doi: 10.1093/treephys/tpp123](http://doi.org/10.1093/treephys/tpp123)12 years ago
- The colonization of cut pine stems by wood-inhabiting insects was investigated at various elevations. The study sites were located in the regions of Aosta Valley (Italy), Valais (Switzerland), and Grisons (Switzerland). In each region, there were two gradients in pine (Pinus sylvestris) forests, with three study sites at 900 m, 1200 m, and 1600 m a.s.l. each. Vital trees were felled in late autumn and the stems were colonized by pioneering xylophagous insects and their natural enemies next spring. Pieces of these stems were cut and exposed in emergence traps in a greenhouse. In each region the survey was done in two consecutive years. Please contact author for terms of use.12 years ago
- The instrument (MRR, Metek) was mounted at Gotschnagrat (LON: 46.859 LAT: 9.849) at a height of 1 m above snow surface (at the beginning of the campaign) with an orientation of 22° with respect to North and a horizontal viewing direction. The sampling time was either 5 s or 10 s, depending on the settings at the specific period. The MRR produces standard outputs like radar reflectivity, doppler velocity, etc., and additional information can be found [here](https://metek.de/de/product/mrr-2/).52 years ago
- A rule-based algorithm [(Schwieder et al., 2022)](https://doi.org/10.1016/j.rse.2021.112795) was used to produce annual maps for 2018–2021 of grassland-management events, i.e. mowing and/or grazing, for Switzerland using Sentinel-2 and Landsat 8 satellite time series. All satellite images were processed with the [FORCE](https://force-eo.readthedocs.io) framework. The resulting maps provide information on the number and timing of grassland-management events at a spatial resolution of 10 m × 10 m for the whole of Switzerland. For the final maps, permanent grasslands were masked using a variety of land-use layers, according to [Huber et al. (2022)](https://doi.org/10.1002/rse2.298) but replacing the crop mask with the agricultural-use data from the cantons. We assessed the detection of management events based on independent reference data, which we acquired from daily time series of publicly available webcams that are widely distributed across Switzerland. We further tested the ecological relevance of the generated intensity measures in relation to nationwide biodiversity data (see Weber et al., 2023; IN REVIEW).72 years ago
- The Federal Office for the Environment (FOEN) is responsible for granting exemptions for forest clearances that in principle are prohibited in Switzerland. Initiators of infrastructure projects have to submit an examption approval request to the cantonal forest administration which has to inform the FOEN. The FOEN thus administers a dataset of forest clearance requests and approval decisions that can be requested there. This dataset contains information on a coding of the content of all the forest clearance requests between 2001 and 2017, that elicits whether the reason for the clearance can be attributed to "sustainable economy" objectives such as "green economy", "bioeconomy" and "circular economy".12 years ago
- Raw data supporting the paper "Countrywide wild bee taxonomic and functional diversity reveal a spatial mismatch between alpha and beta-diversity facets across multiple ecological gradients". It contains taxonomic and functional metrics in 3343 community-plots distributed across Switzerland. The calculated metrics are: - Alpha taxonomic community metrics: species richness and Shannon diversity - Alpha functional community metrics: Functional richness (using the Trait Onion Peeling index, TOP), functional eveness (using the Trait Even Distribution index, TED) and the functional dispersion. - Community weighted means of 8 functional traits - The local community contributions on the functional and taxonomic beta diversity (LCBD). The dataset also includes the following: - The used predictors to model the spatial distribution of the community metrics (climate PCA, vegetation PCA, land-use metrics, beekeeping intensity). -The three types of protected areas, defined according to the protective measures. - The model evaluation, variable importance and partial dependece data.72 years ago
- Reference Elevation Model of Antarctica (REMA) topography and AntarcticaLC2000 landuse data are now available as static data input for the Weather Research and Forecasting model (WRF). Topography and landuse are made available at a spatial resolution of 1 km. This documentation describes the methods applied to convert REMA and AntarcticaLC2000 to WRF readable format and shows how this improves the representation of the Antarctic topography and landuse categories over coastal Antarctic regions.32 years ago
- # General description Genomic data, habitat suitability raster files and scripts to run gen3sis to simulate cumulative divergence over time as approximation for genetic differentiation. Scripts for basic analysis of the simulations (e.g., create distance matrix from sampling locations) are provided, too. See original publication (doi link will be provided after publication) for details. The study area are the European Alps. All data is uploaded as zipped file. Unzip them after the download and put all data in one folder. See linked publications for correct citation of the data used, use of the data without correct citation is not allowed. __Corresponding author__: Flurin Leugger, email: flurin.leugger@gmail.com # Description of the data (content of the different zip folders) ## Abiotic data ### Glaciers Folders with raster stacks with glaciated areas at 0.05° resolution in WGS84 projection from Seguinot et al. (2018). Seguinot, J., Ivy-Ochs, S., Jouvet, G., Huss, M., Funk, M., & Preusser, F. (2018). Modelling last glacial cycle ice dynamics in the Alps. _The Cryosphere, 12(10)_, 3265–3285. https://doi.org/10.5194/tc-12-3265-2018 ### Rivers * __river_raster_elevation_class.tif__: raster file (.tif) at 0.05° resolution and WGS84 projection with large rivers (scenario 2 from publication). The rivers (each cell) is classified according to the elevation of the cell. Natural Earth. (2018). Rivers + lake centerlines version 4.1.0. Retrieved January 22, 2020, from https://www.naturalearthdata.com/downloads/50m-physical-vectors/50m-rivers-lake-centerlines * __river_raster_strahler_class_5km.tif__: raster file at 0.05° resolution and WGS84 projection with medium rivers. The rivers are classified according to their Strahler order. Food and Agriculture Organization of the United Nations. (2014). Rivers in Europe (Derived from HydroSHEDS). Retrieved January 29, 2020, from http://www.fao.org/geonetwork/srv/fr/google.kml?uuid=e0243940-e5d9-487c-8102-45180cf1a99f&layers=AQUAMAPS:37253_rivers_europe ## Fossil records * __chamois_fossil_combined_public.xlsx__: list with fossil records until 20,000 years BP from Central Europe, see linked references for citation. ## Chamois occurrences * __chamois_occurrence.csv__: Chamois presences from all sources used for the publication (see Suppl. mat. Table S1 for detailed information and correct citations of the data) aggregated at 0.05° resolution (~5km). ## Gen3sis * __config__: folders with all configuration files used to run the simulations for the publication (different dispersal divergence parameters). * __scripts__: scripts (and helper functions) to run the gen3sis simulations including scripts for the beginning of the subsequent analysis. ## Genetic * __populations.snps.light.vcf__: vcf file of the sampled Northern chamois _(Rupicapra rupicapra)_ . The genomic data encompasses 20k SNPs (from ddRAD sequencing). * __Sequencing_final_without_slovakia.txt__: sampling locations of Northern chamois _(Rupicapra rupicapra)_ ## HSM * __habitat_suitability_hindcasting__: Aggregated habitat suitability raster files (stacks, .grd files) at 0.05° resolution and WGS84 projection from 20,000 years BP until today in 100 year time steps. There are separate folders for each environmental variable scenario used (different terrain slope variables) an the different occurrence/pseudo-absence sampling strategy used. * __ODMAP_LeuggerEtAl__2021-10-25.csv__: ODMAP protocol72 years ago
-  LWF Plot Lens - Community: Lens / canton VS - Date of installation: 15 March 1996 - Size of the plot: 2 ha - Altitude: 1033-1093 m - Mean slope: 75% - Geology (in German): Untergrund: Penninikum, Ferret-Zone, Trias; sandiger Kalkstein - Oberfläche: Hängeschutt - Provisional soil type (WSL): Calcaric Cambisol - Woodland association after EK72: +- 64: Cytiso-Pinetum silvestris - Main tree species: Pinus sylvestris - Management system: high forest - Silvicultural system: unmanaged - Top-height diameter (quadratic average diameter of the 100 thickest trees per ha): 31.8 cm - Number of trees BHD >= 12 cm (2011): 2304 - Maximum tree age:150-170 yr More Information: https://www.wsl.ch/en/forest/forest-development-and-monitoring/long-term-forest-ecosystem-research-lwf/sites/lens.html22 years ago
- Continuous stem radius measurements to investigate carbon balance and water relations of trees ### Purpose: ### Assessment of growth and water related stem changes12 years ago
- Raw tree ring data and climate used in the following paper: Vitasse Y, Bottero A, Cailleret M et al. (2019) Contrasting resistance and resilience to extreme drought and late spring frost in five major European tree species. Glob Chang Biol, 25, 3781-3792.62 years ago
- Data on phosphomonoesterase activity in forest topsoil leachates and soil extracts as well as P forms in the leachate. Leachate samples were taken in Feb./Mar. and July 2019 with zero-tension lysimeters at two sites in Germany of contrasting phosphorus availability from the litter, the Oe/Oa, and the A horizon in beech forest. Soil samples were taken in July 2019. For methods see publication.12 years ago
- Number of forest edges according to the NFI definition. __Citation:__ > _Abegg, M.; Brändli, U.-B.; Cioldi, F.; Fischer, C.; Herold-Bonardi, A.; Huber M.; Keller, M.; Meile, R.; Rösler, E.; Speich, S.; Traub, B.; Vidondo, B. (2014). Fourth national forest inventory - result tables and maps on the Internet for the NFI 2009-2013 (NFI4b). [Published online 06.11.2014] Available from World Wide Web http://www.lfi.ch/resultate/ Birmensdorf, Swiss Federal Research Institute WSL. [doi:10.21258/1057112](https://doi.org/10.21258/1057112)_32 years ago
- Number of all living and dead trees and shrubs starting at 12 cm dbh where a particular type of damage (including no damage, dead or lying) was observed. One tree may have more than one type of damage, which means it may contribute to the total number of stems for several different types of damage. __Citation:__ > _Abegg, M.; Brändli, U.-B.; Cioldi, F.; Fischer, C.; Herold-Bonardi, A.; Huber M.; Keller, M.; Meile, R.; Rösler, E.; Speich, S.; Traub, B.; Vidondo, B. (2014). Fourth national forest inventory - result tables and maps on the Internet for the NFI 2009-2013 (NFI4b). [Published online 06.11.2014] Available from World Wide Web http://www.lfi.ch/resultate/ Birmensdorf, Swiss Federal Research Institute WSL. [doi:10.21258/1057112](https://doi.org/10.21258/1057112)_22 years ago
-  LWF Plot Neunkirch - Community: Neunkirch / canton SH - Date of installation: 14 July 1995 - Size of the plot: 2 ha - Altitude (m): 554-609 - Mean slope: 58% - Geology (in German): Tafeljura, oberer Malmkalk; Malmhängeschutt - Soil types (WSL) : Rendzic Leptosols - Woodland association after EK72: 13: Cardamino-Fagetum tilietosum - Main tree species: Fagus sylvatica - Management system: former coppices w. standards - Silvicultural system: reserve - Top-height diameter (quadratic average diameter of the 100 thickest trees per ha): 56.5 cm - Number of trees BHD >= 12 cm (2011): 442 - Maximum tree age: Fagus sylvatica 160 yr - Acer pseudoplatanus 160 yr - Tilia sp. 110 yr More Information: https://www.wsl.ch/en/forest/forest-development-and-monitoring/long-term-forest-ecosystem-research-lwf/sites/neunkirch.html22 years ago
- The Swiss FluxNet Site Davos is a managed subalpine evergreen forest, located on the Seehorn mountain near Davos in the Swiss Alps. The site is dominated by Norway spruce. The tower is owned by the Federal Office for the Environment (FOEN). Ecosystem flux measurements of CO2, H2O (since 1997) as well as CH4 and N2O (since 2016) are performed with the eddy covariance method. In addition to Swiss FluxNet, the site is part of the National Air Pollution Monitoring Network (NABEL), the Long term Forest Ecosystem Research (LWF), the biological drought and growth indicator network (TreeNet) and of ICOS Switzerland (Integrated Carbon Observation System). Since November 2019, the site is an ICOS Class 1 Ecosystem station. __Measurements__ - Ecosystem flux measurements of CO2, H2O vapour (since 1997) as well a CH4 and N2O (since 2016) are performed with the eddy-covariance method. This method is based on measurements of trace gas mixing ratios, using infrared gas analyzers (for CO2, H2O vapor) and laser spectrometers (for CH4 and N2O), combined with wind speed and wind direction measurements, using 3D sonic anemometers. To resolve the short-term turbulent fluctuations in the atmosphere, very fast measurements are needed: we measure at 10-20 Hz, i.e., 10-20 times per second. To assess the energy budget of each ecosystem, also radiation sensors and soil climate profiles are installed at the site. - Sub-canopy eddy fluxes (CO2, H2O, since 2023 also CH4). - Continuous profile concentration and forest floor flux measurement of CO2, H2O, CH4, N2O. - Auxiliary micrometeorology and soil climate measurements. __Data availability__ Near real-time flux and meteo data uploaded daily to the ICOS Carbon Portal. Processed flux and meteo data are also available from the European Fluxes Database Cluster and part of Fluxnet2015 dataset. __Data policy__ ICOS data license: [https://www.icos-cp.eu/data-services/about-data-portal/data-license](https://www.icos-cp.eu/data-services/about-data-portal/data-license) __Detailed site info__: [https://www.swissfluxnet.ethz.ch/index.php/sites/ch-dav-davos/site-info-ch-dav/](https://www.swissfluxnet.ethz.ch/index.php/sites/ch-dav-davos/site-info-ch-dav/)42 years ago
- Number of stems of living trees and shrubs (standing and lying) starting at 12 cm dbh. __Citation:__ > _Abegg, M.; Brändli, U.-B.; Cioldi, F.; Fischer, C.; Herold-Bonardi, A.; Huber M.; Keller, M.; Meile, R.; Rösler, E.; Speich, S.; Traub, B.; Vidondo, B. (2014). Fourth national forest inventory - result tables and maps on the Internet for the NFI 2009-2013 (NFI4b). [Published online 06.11.2014] Available from World Wide Web http://www.lfi.ch/resultate/ Birmensdorf, Swiss Federal Research Institute WSL. [doi:10.21258/1057112](https://doi.org/10.21258/1057112)_42 years ago
- Volume of stemwood with bark of all trees and shrubs starting at 12 cm dbh removed from the forest due to damage occurring (e.g. windthrow, avalanches, insects or rockfall), and not as the result of management planning. This feature is derived on the level of a sample plot from the cuttings of the sample trees and the salvage cut proportion (according to information from the forester). The correction for bias with the sample Tarif trees may be so drastic that it results in negative values with small numbers of trees. __Citation:__ > _Abegg, M.; Brändli, U.-B.; Cioldi, F.; Fischer, C.; Herold-Bonardi, A.; Huber M.; Keller, M.; Meile, R.; Rösler, E.; Speich, S.; Traub, B.; Vidondo, B. (2014). Fourth national forest inventory - result tables and maps on the Internet for the NFI 2009-2013 (NFI4b). [Published online 06.11.2014] Available from World Wide Web http://www.lfi.ch/resultate/ Birmensdorf, Swiss Federal Research Institute WSL. [doi:10.21258/1057112](https://doi.org/10.21258/1057112)_22 years ago
- Datasets used to implement the wet-snow avalanche activity model presented in the article: Hendrick, M., Techel, F., Volpi, M., Olevski, T., Pérez-Guillén, C., van Herwijnen, A., Schweizer, J. (2023). Automated prediction of wet-snow avalanche activity in the Swiss Alps. Journal of Glaciology, under review Each dataset includes the input variables (weather and snowpack features) and the target variable (wet-snow avalanche day or not) used to build the model. Additionally, Dataset3_nowcast and Dataset3_forecast contain the predictions provided by the RF12 model. All input variables are described in the Appendix of the article and also in the read_me file. Further information on SNOWPACK variables is also available at https://models.slf.ch/p/snowpack/ .52 years ago
- This snow depth map was generated 14 January 2015, close to peak of winter accumulation, applying Unmanned Aerial System digital surface models with a spatial resolution of 10 cm. The covered area is 285'000 m2 at the top of Brämabüel, 2490 m a.s.l. covering all expositions. Coordinate system: CH1903LV03. A detailed description is given here: Bühler, Y., Adams, M. S., Bösch, R., and Stoffel, A.: Mapping snow depth in alpine terrain with unmanned aerial systems (UASs): potential and limitations, The Cryosphere, 10, 1075-1088, 10.5194/tc-10-1075-2016, 2016. Abstract: Detailed information on the spatial and temporal distribution, and variability of snow depth (HS) is a crucial input for numerous applications in hydrology, climatology, ecology and avalanche research. Nowadays, snow depth distribution is usually estimated by combining point measurements from weather stations or observers in the field with spatial interpolation algorithms. However, even a dense measurement network is not able to capture the large spatial variability of snow depth in alpine terrain. Remote sensing methods, such as laser scanning or digital photogrammetry, have recently been successfully applied to map snow depth variability at local and regional scales. However, such data acquisition is costly, if manned airplanes are involved. The effectiveness of ground-based measurements on the other hand, is often hindered by occlusions, due to the complex terrain or acute viewing angles. In this paper, we investigate the application of unmanned aerial systems (UAS), in combination with structure-from-motion photogrammetry, to map snow depth distribution. Such systems have the advantage that they are comparatively cost-effective and can be applied very flexibly to cover also otherwise inaccessible terrain. In this study we map snow depth at two different locations: a) a sheltered location at the bottom of the Flüela valley (1900 m a.s.l.) and b) an exposed location (2500 m a.s.l.) on a peak in the ski resort Jakobshorn, both in the vicinity of Davos, Switzerland. At the first test site, we monitor the ablation on three different dates. We validate the photogrammetric snow depth maps using simultaneously acquired manual snow depth measurements. The resulting snow depth values have a root mean square error (RMSE) better than 0.07 to 0.15 m on meadows and rocks and a RMSE better than 0.30 m on sections covered by bushes or tall grass. This new measurement technology opens the door for efficient, flexible, repeatable and cost effective snow depth monitoring for various applications, investigating the worlds cryosphere.22 years ago
- Volume of stemwood with bark of all trees and shrubs starting at 12 cm dbh that were used, died or disappeared between two inventories. *In the calculation no D7/tree height data were used. The values calculated like this have not been corrected for bias, but allow for cantons or forest districts a more robust estimation of changes and could thus be better interpreted. __Citation:__ > _Abegg, M.; Brändli, U.-B.; Cioldi, F.; Fischer, C.; Herold-Bonardi, A.; Huber M.; Keller, M.; Meile, R.; Rösler, E.; Speich, S.; Traub, B.; Vidondo, B. (2014). Fourth national forest inventory - result tables and maps on the Internet for the NFI 2009-2013 (NFI4b). [Published online 06.11.2014] Available from World Wide Web http://www.lfi.ch/resultate/ Birmensdorf, Swiss Federal Research Institute WSL. [doi:10.21258/1057112](https://doi.org/10.21258/1057112)_32 years ago
- In Novdember 2019 about 19 experts on forest surface protection and forest clearances were invited to a workshop in order to discuss policy design and implementation problems regarding the offsetting of forest clearances. In Switzerland such offsetting can be provided under certain circumstances by implementing forest nature conservation measures in the forest instead of providing in-kind compensation, i.e. reafforestation on agricultural land. The workshop included the sorting of 34 statements – that were elaborated beforehand, partially also with help of the participants – according to the "Q-methodology" survey technique (participants arrange given statements about a certain subject into boxes that are normally distributed over a "agree - do not agree" answer scale). The participants included representatives from cantonal and national forest administrations, nature conservation NGOs, forest NGOs, spatial planning NGOs, private counseling enterprises as well as national, cantonal and regional forest owner organizations. The data allows a factor analytical differentiation of actors into groups with distinct positions towards forest clearance compensation as well as a positioning of these groups relative to each statement.32 years ago
- This work presents the first extensive study of climate change impacts on rivers temperature in Switzerland. Results show that even for low emissions scenarios, water temperature increase will lead to adverse effect for both ecosystems and socioeconomic sectors (such as nuclear plant cooling) throughout the 21st century. For high emissions scenarios, the effect will be worsen. This study also shows that water warming in summer will be more important in Alpine regions than in lowlands. This material is distributed under CC BY 4.0 license (https://creativecommons.org/licenses/by/4.0/legalcode).12 years ago
- (English version below) Ziel dieser Faktenblätter ist es Informationen zu den Schätzmethoden, Hinweise zur Parametrisierung und eine grobe Einschätzung der Güte der Resultate in übersichtlicher Form bereitzustellen. Ein zeitaufwändiges Zusammensuchen dieser Informationen aus unterschiedlichen Quellen entfällt daher weitgehend. Die Bearbeitenden sollen damit in der Lage sein, sich innerhalb weniger Minuten die wichtigsten Hintergrundinformationen zu jeder der vorgestellten Methoden in Erinnerung zu rufen. Der Leitfaden unterstützt bei der Plausibilisierung und bei der Mittelung der Ergebnisse der einzelnen Schätzmethoden zu einem repräsentativen Endergebnis. Vorausgesetzt wird Grundwissen und Erfahrung in der Thematik. Der Leitfaden führt die Fachperson anhand eines Entscheidungsbaums in acht Schritten durch den Arbeitsablauf und unterstützt mit einem Fragenkatalog bei der Plausibilisierung der Ergebnisse. Auf den Faktenblättern sind für jede Schätzmethode alle relevanten Informationen stichwortartig und grafisch übersichtlich auf einer DIN-A4 Seite zusammengefasst. Jedes Faktenblatt ist einheitlich gegliedert. The aim of these fact sheets is to provide information on the flood estimation methods, notes on their parameterization and a rough assessment of the quality of the results in a clear form. A time-consuming research for this information from different sources is therefore largely eliminated. The users should be able to recall the most important background information on each of the methods presented within a few minutes. The guide provides support in checking plausibility and averaging the results of the individual estimation methods to produce a representative final result. Basic knowledge and experience in the subject are assumed. The guide leads the expert through the workflow in eight steps using a decision tree and supports the plausibility check of the results with a list of questions. On the fact sheets, all relevant information for each estimation method is summarized with key words and graphics on one DIN A4 page. Each fact sheet has a standardized structure.12 years ago
- The fate of plastic in the environment is of global concern, because its production recently has increased strongly and it accumulates in terrestrial and aquatic ecosystems. Although some knowledge on its role in aquatic and terrestrial ecosystems was gained in the recent decade, hitherto very little is known about the impact of micro and nanoplastics in forest ecosystems. The aim of this pioneering project was to explore if nanoplastics are taken up by forest trees species through leaves or roots. In greenhouse experiments, we exposed leaves or roots of seedling of two forest trees species to solutions with highly 13C-labelled polystyrene nanoparticles (13C-nPS, 99 atom%) and examined if they were incorporated in different above- and belowground tissues. Treated part of the trees for both species showed significant 13C-enrichment, indicating that trees take up nanoparticles. However, the overall 13C signal strength in tissues that were not exposed to the 13C label remained low (Δδ13C<1‰) and was confined to a few seedlings, leaving it ambiguous whether nanoplastic transport occurs or not. We acknowledge that the new method developed might be not sensitive enough to unequivocally detect mechanisms of nanoplastic uptake and transport at environmentally realistic concentrations.12 years ago
- The length of forest roads corresponds to the length of the NFI forest roads. This length was calculated according to the method of the specific NFI concerned. __Citation:__ > _Abegg, M.; Brändli, U.-B.; Cioldi, F.; Fischer, C.; Herold-Bonardi, A.; Huber M.; Keller, M.; Meile, R.; Rösler, E.; Speich, S.; Traub, B.; Vidondo, B. (2014). Fourth national forest inventory - result tables and maps on the Internet for the NFI 2009-2013 (NFI4b). [Published online 06.11.2014] Available from World Wide Web http://www.lfi.ch/resultate/ Birmensdorf, Swiss Federal Research Institute WSL. [doi:10.21258/1057112](https://doi.org/10.21258/1057112)_12 years ago
- Dry weight (mass) of living trees and shrubs starting at 12 cm dbh. This consists of the tree parts: roots, stemwood, branch coarse wood, brushwood/twigs and needles/leaves. The correction for bias with the sample Tarif trees may be so drastic that it results in negative values with small numbers of trees. __Citation:__ > _Abegg, M.; Brändli, U.-B.; Cioldi, F.; Fischer, C.; Herold-Bonardi, A.; Huber M.; Keller, M.; Meile, R.; Rösler, E.; Speich, S.; Traub, B.; Vidondo, B. (2014). Fourth national forest inventory - result tables and maps on the Internet for the NFI 2009-2013 (NFI4b). [Published online 06.11.2014] Available from World Wide Web http://www.lfi.ch/resultate/ Birmensdorf, Swiss Federal Research Institute WSL. [doi:10.21258/1057112](https://doi.org/10.21258/1057112)_22 years ago
- In April 2020, about 1700 forest owners of the plateau region of the Canton of Berne were invited to participate in a survey (virtually all of them received a conventional paper-pencil questionnaire) about their willingness to provide forest nature conservation measures in their forest to compensate forest clearances that cannot be compensated by afforestation. The questionnaire contained a survey experiment (conjoint analysis) that offered a choice between two options and the status quo in 9 decision-making situations. Of the 607 completed questionnaires that were returned the survey experiment was completed by about 400.22 years ago
- Two versions of the data are currently available: 2018 and 2016. The 2018 version presents a remote sensing-based approach for a countrywide mapping of the dominant leave type (DLT) with the two classes broadleaved and coniferous in Switzerland. The spatial resolution is 10 m with the fraction of the class broadleaf. The classification approach incorporates a random forest classifier, explanatory variables from multispectral Sentinel-2, multi-temporal Sentinel-1 data and a Digital Terrain Model (DTM) from Airborne Laser Scanning (ALS) data. The models were calibrated using digitized training polygons and independently validated data from the National Forest Inventory (NFI). Whereas high model overall accuracies (0.97) and kappa (0.96) were achieved, the comparison of the tree type map with independent NFI data revealed deviations in mixed stands. In the 2016 version (3 m spatial resolution), the classification approach incorporates a random forest classifier, explanatory variables from multispectral aerial imagery and a Digital Terrain Model (DTM) from Airborne Laser Scanning (ALS) data, digitized training polygons and independent validation data from the National Forest Inventory (NFI). Whereas high model overall accuracies (0.99) and kappa (0.98) were achieved, the comparison of the tree type map with independent NFI data revealed significant deviations that are related to underestimations of broadleaved trees (median of 3.17%).42 years ago
- The data includes (1) amphibian occurrence data (2017-2019) for ten species across the cantons of Aargau and Zürich gathered from the Coordination Center for the Protection of Amphibians and Reptiles of Switzerland (http://www.karch.ch), (2) amphibian whole-life cycle environmental predictors (i.e. topographic, hydrologic, edaphic, vegetation, land-use derived, movement-ecology related), and (3) local urban "green" and "grey" landcover data which can be used to identify opportunities for Blue-Green Infrastructure (through green or grey transitions) in support of regional landscape connectivity.52 years ago
- 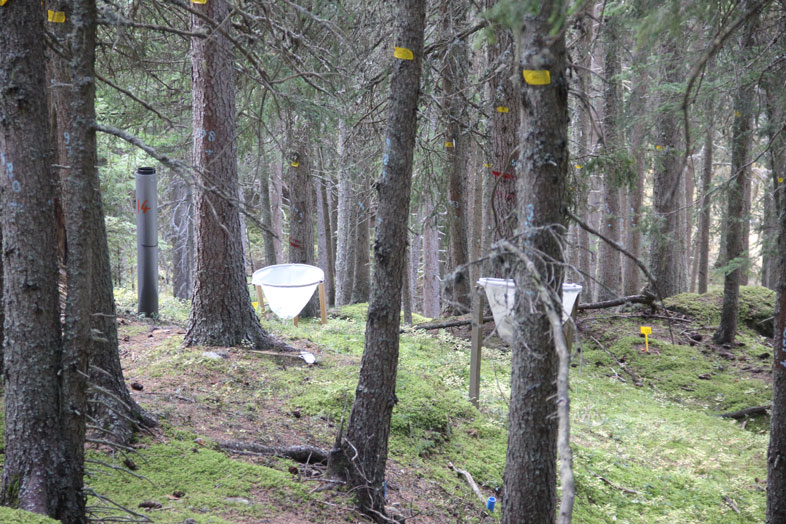 This research site is located on the Seehorn mountain near Davos within a managed subalpine coniferous forest in the Swiss Alps. Seehronwald Davos site is dedicated to forest ecosystem research with current projects focusing on topics of climate change, ecosystem carbon balance, ecophysiology, vegetation and soil sciences. The site belongs to one of the best equipped long-term forest ecology research sites of the world. Time series of climate variables, ecosystem gas exchange (eddy covariance), tree physiology records (sap flow, stem radius changes), and air pollution data cover the history of this site over more than 20 years. Records of local climate variables started in 1876. Since 2013 the site is part of [ICOS](https://www.icos-cp.eu), which awarded the infrastructure the CLASS 1 label on 21 November 2019. The site is part of the following national and international networks and encourages further synergistic collaborations with scientists from all over the world: * National Air Pollution Monitoring Network ([NABEL](https://www.empa.ch/web/s503/nabel)) * ICOS Switzerland ([ICOS-CH](https://www.icos-switzerland.ch/davos)) * [TreeNet](https://treenet.info/switzerland/davos): The biological drought and growth indicator network * Long-term Forest Ecosystem Research ([LWF](https://www.wsl.ch/en/forest/forest-development-and-monitoring/long-term-forest-ecosystem-research-lwf/sites/davos.html)) * [Swiss FluxNet](https://www.swissfluxnet.ethz.ch/index.php/sites/ch-dav-davos/site-info-ch-dav) * Ecosystem Research ([ExpeER](http://www.expeeronline.eu/43-expeer-ta-sites/131-davos-seehornwald-switzerland.html)) * Long Term Ecological Research ([LTER](https://www.lter-europe.net)) * [ICP Forests](http://icp-forests.net): the International Co-operative Programme on Assessment and Monitoring of Air Pollution Effects on Forests The site measurements are jointly run by the Swiss Federal Laboratories for Materials Science and Technology ([EMPA](https://www.empa.ch)), the Swiss Federal Institute of Technology Zurich ([ETHZ](https://www.gl.ethz.ch)), and the Swiss Federal Research Institute ([WSL](https://www.wsl.ch)) in Birmensdorf and Davos. The infrastructure is provided by the Federal Office of Environment ([FOEN](https://www.bafu.admin.ch/bafu/en/home/topics/air/state/data/national-air-pollution-monitoring-network--nabel-.html)). All partners are grateful to forest owners and to the forestry service of the community of Davos for their continuous support. LWF Plot Davos - Community: Davos / canton GR - Date of installation: 15.06.2006 - Size of the plot: 0.6 ha - Altitude: : 1635-1665 - Geology (in German): Untergrund: - Oberfläche: - Provisional soil type (WSL): - Woodland association after EK72: 58: Larici-Piceetum - Main tree species: Picea abies - Management system: high forest - Silvicultural system: group selection - Top-height diameter (quadratic average diameter of the 100 thickest trees per ha): 47.0 cm - Number of trees BHD >= 12 cm (2006): 498 - Maximum tree age: Picea abies: 200 - 390 yr22 years ago
- Here the updated versions of debrisInterMixing are provided for download. The first OpenFoam-compatible Version 2.3.x are available as supplement to v. Boetticher, A., Turowski, J. M., McArdell,W. B., Rickenmann, D., Hürlimann, M., Scheidl, C., and Kirchner, J. W.: DebrisInterMixing-2.3: A Finite Volume solver for three dimensional debris flow simulations based on two calibration parameters. Part two: model validation with experiments. Geoscientific Model Development, 10, 11: 3963-3978. doi: 10.5194/gmd-10-3963-2017. DebrisInterMixing is a Volume-of-Fluid based Finite Volume code that accounts for shear-thinning sensitive shares of fine sediment suspension together with pressure-sensitive components of the gravel grains within debris flow mixtures. All model properties can be derived from a material sample except for a grid-sensitive calibration parameter. For more information, please contact albrecht.vonboetticher@wasserbau.ch.42 years ago
- Measuring air pollutants in forests is important for evaluating the risk for vegetation in areas not covered by conventional air quality monitoring networks. Ozone measurements are carried out at LWF, applying the harmonized methodologies from UNECE/ICP Forests and running under the 1999 Gothenburg Protocol to Abate Acidification, Eutrophication and Ground-level Ozone. Data are also collected on ozone-induced visible symptoms and other ecosystem properties such as tree growth, nutrition, and biodiversity, as well as climate. This makes this long-term monitoring data series essential for impact assessment and air pollution modelling. ### Purpose: ### Ozone risk assessment: Measurements of mean ozone concentrations with passive samplers (passam ag). ### Manual Citation: ### * Schaub M, Calatayud V, Ferretti M, Brunialti G, Lövblad G, Krause G, Sanz MJ, 2016: Part XV: Monitoring of Air Quality. In: UNECE ICP Forests Programme Co-ordinating Centre (ed.): Manual on methods and criteria for harmonized sampling, assessment, monitoring and analysis of the effects of air pollution on forests. Thünen Institute of Forest Ecosystems, Eberswalde, Germany, 11 p. + Annex [http://icp-forests.net/page/icp-forests-manual](http://icp-forests.net/page/icp-forests-manual) ### Paper Citation: ### * Schaub M, Häni M, Calatayud V, Ferretti M, Gottardini E (2018) ICP Forests Brief No 3 - Ozone concentrations are decreasing but exposure remains high in European forests. Programme Co-ordinating Centre of ICP Forests, Thu¨nen Institute of Forest Ecosystems. [doi: 10.3220/ICP1525258743000](https://icp-forests.org/pdf/ICPForestsBriefNo2.pdf) * Cailleret M, Ferretti M, Gessler A, Rigling A, Schaub M (2018) Ozone effects on European forest growth – towards an integrative approach. Journal of Ecology. [doi:10.1111/1365-2745.12941](http://doi.org/10.1111/1365-2745.12941) * Calatayud V, Diéguez JJ, Sicard P, Schaub M, De Marco A (2016) Testing approaches for calculating stomatal ozone fluxes from passive sampler. Science of the Total Environment. [doi:10.1016/j.scitotenv.2016.07.155](http://doi.org/10.1016/j.scitotenv.2016.07.155) * Calatayud V and Schaub M (2013) Methods for Measuring Gaseous Air Pollutants in Forests. In: Marco Ferretti and Richard Fischer (Eds). Forest Monitoring: Methods for Terrestrial Investigations in Europe with an Overview of North America and Asia, Vol 12, DENS, UK: Elsevier, 2013, pp. 375-384. [doi:10.1016/B978-0-08-098222-9.00019-4](http://doi.org/10.1016/B978-0-08-098222-9.00019-4)12 years ago
- This dataset contains eddy-covariance measurements in the ablation period of 2014-2016. Measurements were taken from two turbulence towers over a long-lasting snow patch, which are 5 m apart from each other (2014 and 2015). The turbulence towers were equipped with two YOUNG ultrasonic anemometers mounted 0.7 m (in 2014) and 3.3 m (in 2015) above snow-free ground, two ultrasonic anemometers (CSAT3, Campbell Scientific, Inc.) mounted at 2.6 m (in 2014) and 2.2 m (in 2015) above snow-free ground and one anemometer (DA-600, Kaijo Denki) mounted at 0.3 m above snow surface. The measurement setup changed in 2016 and includes a measurement above the snow-free ground in upwind direction (Swiss coordinates: 790191/176689). The measurement tower is equipped with one ultrasonic anemometer (CSAT3, Campbell Scientific, Inc.) in 3.3 m above the snow-free ground. Additionally, one measurement tower is installed above the long-Lasting snow patch and equipped with the same setup as 2015. Turbulence data were sampled at a frequency of 20 Hz. The processing of the data to quality controlled fluxes has been done with the Biomicrometeorology flux software (Thomas et al., 2009). The program applies plausibility tests and a despiking test after Vickers and Mahrt (1997) on the measured data. The routine further applies a time-lag correction and considers the deployment (e.g. the sonic azimuth). A frequency response correction (Moore, 1986) is done and a three-dimensional rotation is performed. Finally, quality assurance/quality control (QA/QC) flags after Foken et al., (2004) are issued and fast Fourier transform power and co-spectra are calculated. The change in snow height is considered in the post-processing for every measurement day. The turbulence data were averaged to 30 minute intervals.162 years ago
- Volume of stemwood with bark of all trees and shrubs starting at 12 cm dbh removed from the forest as a result of damage occurring between two inventories, in this case windthrow, and not because of management planning. This theme is derived on the level of a sample plot from the cutting of the sample trees and the salvage cut proportion (according to information from the forester). *In the calculation no D7/tree height data were used. The values calculated like this have not been corrected for bias, but allow for cantons or forest districts a more robust estimation of changes and could thus be better interpreted. __Citation:__ > _Abegg, M.; Brändli, U.-B.; Cioldi, F.; Fischer, C.; Herold-Bonardi, A.; Huber M.; Keller, M.; Meile, R.; Rösler, E.; Speich, S.; Traub, B.; Vidondo, B. (2014). Fourth national forest inventory - result tables and maps on the Internet for the NFI 2009-2013 (NFI4b). [Published online 06.11.2014] Available from World Wide Web http://www.lfi.ch/resultate/ Birmensdorf, Swiss Federal Research Institute WSL. [doi:10.21258/1057112](https://doi.org/10.21258/1057112)_22 years ago
- Volume of stemwood with bark of all dead trees and shrubs (standing and lying) starting at 12 cm dbh recorded according to the NFI1 method. In NFI1 only those dead trees were recorded whose wood could still be exploited. In addition, lying green trees were classified in NFI1 as deadwood. __Citation:__ > _Abegg, M.; Brändli, U.-B.; Cioldi, F.; Fischer, C.; Herold-Bonardi, A.; Huber M.; Keller, M.; Meile, R.; Rösler, E.; Speich, S.; Traub, B.; Vidondo, B. (2014). Fourth national forest inventory - result tables and maps on the Internet for the NFI 2009-2013 (NFI4b). [Published online 06.11.2014] Available from World Wide Web http://www.lfi.ch/resultate/ Birmensdorf, Swiss Federal Research Institute WSL. [doi:10.21258/1057112](https://doi.org/10.21258/1057112)_12 years ago
- High quality meteorological data are needed for long-term forest ecosystem research, particularly in the light of global change. The long-term data series published here comprises almost 20 years of measurements for two meteorological stations in Schänis in Switzerland where one station is located within a natural mixed forest stand (SCB) with European beech (_Fagus sylvatica_; 130-150 yrs), European silver fir (_Abies alba_; 130-150 yrs) and European ash (_Fraxinus excelsior_; 130-150 yrs) as dominant tree species. A second station is situated in the very vicinity outside of the forest (field station, SCF). The meteorological time series are presented in hourly time resolution of air temperature, relative humidity, precipitation, photosynthetically active radiation (PAR) and wind speed. Schänis is part of the Long-term Forest Ecosystem Research Programme (LWF) established and maintained by the Swiss Federal Research Institute WSL.82 years ago
- # Background information The Stillberg ecological treeline research site in the Swiss Alps was established in 1975, with the aim to develop ecologically, technically, and economically sustainable reforestation techniques at the treeline to reduce the risk of snow avalanches. In the course of time, additional research aspects gained importance, such as the ecology of the treeline ecotone under global change. Long-term monitoring of the large-scale high-elevation afforestation has generated data about tree growth, survival, and vitality. In addition, detailed characteristics of the microsite conditions of the research were conducted. Besides providing a scientific basis and practical guidelines for high-elevation afforestation, this research has contributed to a comprehensive understanding of ecological processes in the treeline ecotone. # Experiment description The Stillberg afforestation experiment was established in 1975 by planting 92,000 seedlings of *Larix decidua*, *Pinus cembra* and *Pinus mugo* ssp. *uncinata* in the alpine treeline ecotone. The afforestation site is located on a northeast-facing slope with steep, topographically highly structured terrain and covers elevations from 2075 to 2230 m a.s.l. The afforestation site was divided into 4052 square plots of 3.5 × 3.5 m, arranged in a regular species-alternating pattern over the whole area. Each plot contained 25 trees of one species (1350 plots per species), and the seedlings were systematically planted 70 cm apart. The trees have been monitored since 1975. Specifically, tree mortality was assessed annually from 1975 until 1995 and has been documented every ten years since then, with surveys in 2005 and 2015 (the next survey is due in 2025). Height of the surviving trees was measured in 1975, 1979, 1982, 1985, 1990, 1995, 2005, and 2015. In 1995, 2005, and 2015, drivers of tree vitality were assessed for a subset of trees per plot. Additionally, an extensive set of environmental parameters characterizing microsite conditions of the afforestation area were recorded before and after the planting of the trees. # Data description The five datasets from the afforestation experiment comprise ecological and environmental data from the main afforestation experiment in five datasets with accompanying metadata (Stillberg_afforestation_all_metadata.xlsx). All data and metadata files are bundled in a ZIP-file (Stillberg_afforestation_v1.zip). In particular, a first dataset contains environmental data characterising microsite conditions of the 4000 plots with regard to soil, topography, vegetation and microclimatic conditions (Stillberg_afforestation_plot_data_v1.csv; Stillberg_afforestation_plot_metadata_v1.csv. In each plot, the natural tree regeneration was assessed by counting seedings of several tree species in 2005 and 2015 (Stillberg_afforestation_regeneration_data_v1.csv; Stillberg_afforestation_regeneration_metadata_v1.csv). Furthermore, specific information about each of the 92’000 planted trees of the tree species is available (Stillberg_afforestation_tree_parameter_data_v1.csv; Stillberg_afforestation_tree_parameter_metadata_v1.csv). Survival data for each of the 92’000 individual trees can be found in a separate dataset (Stillberg_afforestation_tree_survival_data_v1.csv; Stillberg_afforestation_tree_survival_metadata_v1.csv). Tree growth and vitality parameters are available for all trees from 1995, and for subsets of trees for 2005 and 2015 (Stillberg_afforestation_tree_measurements_data_v1.csv; Stillberg_afforestation_tree_measurements_metadata_v1.csv).12 years ago
- Meteorological station at Gemstock (3021 m asl) in Canton Uri. The station includes in/out LW/SW and a snow height sensor.12 years ago
- Wood volume of all deadwood recorded according to the NFI3 method. For standing trees and shrubs starting at 12 cm dbh, the volume of stemwood reduced due to stem breakage is recorded, and for lying deadwood the merchantable wood ( starting at 7 cm in diameter). Heaps of branches are not included. The correction for bias with the sample Tarif trees may be so drastic that it results in negative values with small numbers of trees. __Citation:__ > _Abegg, M.; Brändli, U.-B.; Cioldi, F.; Fischer, C.; Herold-Bonardi, A.; Huber M.; Keller, M.; Meile, R.; Rösler, E.; Speich, S.; Traub, B.; Vidondo, B. (2014). Fourth national forest inventory - result tables and maps on the Internet for the NFI 2009-2013 (NFI4b). [Published online 06.11.2014] Available from World Wide Web http://www.lfi.ch/resultate/ Birmensdorf, Swiss Federal Research Institute WSL. [doi:10.21258/1057112](https://doi.org/10.21258/1057112)_22 years ago
- Number of stems of dead trees and shrubs (standing and lying) starting at 12 cm recorded according to the NFI1 method. In NFI1 only those dead trees were recorded whose wood could still be exploited. In addition, lying green trees were classified in NFI1 as deadwood. __Citation:__ > _Abegg, M.; Brändli, U.-B.; Cioldi, F.; Fischer, C.; Herold-Bonardi, A.; Huber M.; Keller, M.; Meile, R.; Rösler, E.; Speich, S.; Traub, B.; Vidondo, B. (2014). Fourth national forest inventory - result tables and maps on the Internet for the NFI 2009-2013 (NFI4b). [Published online 06.11.2014] Available from World Wide Web http://www.lfi.ch/resultate/ Birmensdorf, Swiss Federal Research Institute WSL. [doi:10.21258/1057112](https://doi.org/10.21258/1057112)_12 years ago
- This repository contains extensive data for the European Alps: - Observations of ~3,500 plant species - Climate (1-km), soil (100-m) and land cover predictors (1km); current and future scenarios (28 CMIP6-GCMs, 2 land cover change and 3 dispersal scenarios i.e., unlimited, no and realistic vegetation dispersal) - Flora migration rates (categorical) and ecological preferences (continuous indicator values) - Regional maps of barriers to migration and water bodies at 100-m resolution - Sampling effort, distance to roads and cities predictors at 100-m resolution - Present and future abundances over the study region at 1-km resolution (~2,000 species) - Present and future multifaceted and uniqueness of the European Alps' Flora at 1-km resolution - Present and future conservation recommendations at 1-km resolution (26 current and future strategies) - Phylogenetic data and functional traits of ~2,000 plants (raw data and classification trees) - All scripts, data and plots used for the analyses, including a singularity container (mini-linux) to run them32 years ago
- The data correspond to the experiments presented and discussed in a paper regarding the interaction between turbulent wind fluctuations and snow saltation mass-fluxes (Paterna, 2016). Each of the nine data files corresponds to a different experiment presented in the paper and conducted in the winter 2014/2015 in the WSL/SLF cold wind tunnel in Davos. For each file the five columns indicate the time from the beginning of the experiment, the streamwise (u’) and the vertical (w’) wind velocity fluctuations, the streamwise (qx) and the vertical (qz) snow mass-flux components. From these time-series the scales of the snow saltation and of the turbulent flow are obtained with respect to the eddy-cycles and snow saltation cycles. From spectral analysis of the time-series a decoupling of the snow saltation from the turbulence forcing reveals two regimes of interaction: a turbulence-dependent regime occurring with weak saltation, and a turbulence-independent regime with strong saltation. Further details can be found at the link below. __Publication__ http://onlinelibrary.wiley.com/doi/10.1002/2016GL068171/abstract12 years ago
- The dataset contains seven environmental layers (average annual temperature, aridity [annual precipitation divided by annual potential evapotranspiration], frost change frequency, precipitation in the driest quarter, mean diurnal temperature range, and precipitation seasonality) modified from CHELSA (https://chelsa-climate.org/) and three soil layers (soil organic matter content, pH water, and clay content) modified from SoilGrids (https://soilgrids.org/).92 years ago
- This dataset is composed of an interview guide used to conduct 43 in-depth, qualitative, and in-person interviews with planning experts, academics and practitioners, in 14 European urban regions and the corresponding interview transcripts (verbatim). These interviews were conducted in the selected urban regions between March and September 2016. They were first digitally recorded and later thoroughly transcribed.22 years ago
- This dataset contains all data, on which the following publication below is based. __Paper Citation:__ _Schlierenzauer, C., Risch, A.C., Schütz, M., Firn, J. 2021. Non-native Eragrostis curvula reduces plant species diversity in pastures of South-eastern Australia even when native Themeda triandra remains co-dominant. Plants 10, 596._ __Please cite this paper together with the citation for the datafile.__ Study area The study was conducted in the lowland grassy woodlands of the Bega Valley Region, which is located in the south-east corner of New South Wales, Australia. Embedded between the Pacific Ocean and the Australian Alps, the lowland grassy woodlands are mostly located on granitic substrates and reach elevations of roughly 500 m above sea level. Typically, these grassy woodlands receive less precipitation (mean annual precipitation between 700-1100 mm) compared to the more elevated areas that surround them (NSW Government - Office of Environment and Heritage 2017). The vegetation is dominated by an open tree canopy layer consisting of Eucalyptus tereticornis Sm, Angophora floribunda Sm. (Sweet) and a range of other eucalypt species. Sometimes shrub or small trees are also present, whereas grasses and forbs form the ground-cover. In areas without intensive agricultural history, this layer is dominated by perennial, tussock grasses such as Themeda triandra Forssk, Microlaena stipoides R.Br (Weeping Grass), Eragrostis leptostachya Steud. (Paddock Lovegrass) and Echinopogon ovatus P.Beauv (Forest Hedgehog Grass). The remaining inter-tussock spaces are occupied by a diversity of growth-restricted grasses and herbaceous forbs (NSW - Department of Planing, Industries and Environment 2019; NSW Government - Office of Environment and Heritage 2017). Clearing, pasture sowing, fertilizer application and livestock grazing resulted in a dramatic decrease in the extent of these natural woodlands, with less than five percent within conservation reserves and overall, with only about 20% of their original extent in New South Wales still existing (Tozer et al. 2010). The remaining areas outside of reserves are threatened by altered fire frequencies, habitat clearing, livestock grazing and especially by non-native plant invasion, particularly Eragrostis curvula (Schrad.) Nees. For this reason, the grassy woodlands are listed as an endangered ecological community in the NSW state legislation. Additionally, they are considered as critically endangered by the Commonwealth of Australia (Threatened Species Scientific Committee (TSSC) 2013). Experimental design and sampling The study was conducted on six farms and in each of them two sites were chosen, representing a paired design. One of the sites at each farm is dominated by native Themeda triandra, the other one co-dominated by non-native Eragrostis curvula and Themeda triandra. All farms are within a radius of approximately 10 km from the town Candelo. Three of the farms are located North (36°40’ to 36°42’ S and 149°38’ to 149°42’ E) and three of them are located South (36°51’ to 36°49’ S and 149°38’ to 149°42’ E) of Candelo. Non-native herbivores (mainly cattle, sheep and rabbits) and native herbivorous marsupials (mainly kangaroos, wallabies and wombats) are present in the area of these sites. On each site, data was collected within four plots (each 1 x 1 m) in May and November 2020. All plant species found within a plot were recorded and their relative abundance was estimated. References NSW - Department of Planing, Industries and Environment. 2019. “Lowland Grassy Woodland in the South East Corner Bioregion - Endangered Ecological Community Listing.” https://www.environment.nsw.gov.au/topics/animals-and-plants/threatened-species/nsw-threatened-species-scientific-committee/determinations/final-determinations/2004-2007/lowland-grassy-woodland-south-east-corner-bioregion-endangered-ecological-community-l (February 18, 2021). NSW Government - Office of Environment and Heritage. 2017. “Lowland Grassy Woodland in the South East Corner Bioregion - Profile.” https://www.environment.nsw.gov.au/threatenedSpeciesApp/profile.aspx?id=20070 (January 31, 2021). Threatened Species Scientific Committee (TSSC). 2013. Environment Protection and Biodiversity Conservation Act 1999 (EPBC Act) Conservation Advice for Lowland Grassy Woodland in the South East Corner Bioregion. http://www.environment.gov.au/biodiversity/threatened/communities/pubs/82-conservation-advice.pdf. Tozer, Mark et al. 2010. “Native Vegetation of Southeast NSW: A Revised Classification and Map for the Coast and Eastern Tablelands.” Cunninghamia : a journal of plant ecology for eastern Australia 11(3): 359–406.22 years ago
- Incoming and outgoing shortwave and longwave 2 min radiation measurements in Davos Dorf, CH. ### References 1. Marty, C., Philipona, R., Frohlich, C., Ohmura, A.. Altitude dependence of surface radiation fluxes and cloud forcing in the alps: results from the alpine surface radiation budget network. 2002. Theoretical and Applied Climatology. Volume 72. Issue 3-4. 137-155. http://dx.doi.org/10.1007/s007040200019. 10.1007/s007040200019. 2. Christoph Marty. Surface Radiation, Cloud Forcing and Greenhouse Effect in the Alps. 2000. Institute fuer Klimaforschung ETH. Zuercher Klima-Schriften. Volume 79. http://e-collection.library.ethz.ch/eserv/eth:23491/eth-23491-01.pdf.42 years ago
- The present content is part of the published paper Palka, G., Oliveira, E., Pagliarin, S., & Hersperger, A. M. (2021). Strategic spatial planning and efficacy: an analytic hierarchy process (AHP) approach in Lyon and Copenhagen. European planning studies, 29(6), 1174-1192. It contains the jupyter notebook and sample data to compute Analytical Hierarchy Process, and a report on its use.12 years ago
- Included are three direct numerical simulations results of Stokes flow in three heterogeneous porous media obtained with OpenFoam simulations. In addition we include three data files that contain point-based extracted pores based on the post-processing as reported in the submitted paper "Local hydraulic resistance in heterogeneous porous media" in GRL.22 years ago
- Preferential deposition of snow and dust over complex terrain is responsible for a wide range of environmental processes, and accounts for a significant source of uncertainty in surface mass balances of cold and arid regions. Despite the growing body of literature on the subject, previous studies reported contradictory results on the location and magnitude of deposition maxima and minima. This study aims at unraveling the governing processes of preferential deposition in neutrally stable atmosphere and to reconcile seemingly inconsistent results of previous works. For this purpose, a comprehensive modeling approach is developed, based on large eddy simulations of the turbulent airflow, Lagrangian stochastic model of particle trajectories, and immersed-boundary method to represent the underlying topography. The model performance is tested against wind tunnel measurements of dust deposition around isolated and sequential hills. A scale analysis is then performed to investigate the dependence of snowfall deposition on the particle Froude and Stokes numbers, which fully account for the governing processes of inertia, flow advection, and gravity. Additional simulations are performed, to test whether the often used assumption of inertialess particles yields accurate deposition patterns. We finally show that our scale analysis provides qualitatively similar results for hills with different aspect ratios. This dataset contains the results of the LES-LSM model. Each Matlab file contains a 2D array of deposition values (in kg/m2) in each surface node (ix, iy) of the Cartesian grid. The file names are consistent with the simulation numbers listed in the original paper. For additional information, please refer to "Preferential deposition of snow and dust over hills: governing processes and relevant scales" by F. Comola, M. G. Giometto, S. T. Salesky, M. B. Parlange, and M. Lehning, Journal of Geophysical Research: Atmospheres, 2019.12 years ago
- For the investigation of microstructural and mechanical properties of snow unconfined compression experiments and 3D computed tomography (CT) imaging were performed on sintered rounded grain snow and spherical model snow. The spherical model snow was generated to create geometrically simplified, well-defined microstructures for calibration of numerical models, such as discrete element models (DEM) in which the microstructure is represented by spherical particles. In the experiments, microstructural variation was created by varying the sintering time (contact size) and the density of the ice sphere samples (number of contacts). The 3D CT images allow for a complete reconstruction of the entire experimental sample (cylindrical sample dimension: diameter = 33.6 mm; height = 14 mm).42 years ago
- This dataset contains the classification and localization results obtained during the automatic classification of avalanches during the winter season 2017.12 years ago
- This dataset contains data and scripts for "CRYOWRF - a validation and the effect of blowing snow on the Antarctic SMB" (Gerber et al., submitted). * Simulation_setup: Namelists and input information to run the simulation. Some input files need to be downloaded from Sharma et a., 2021. * Static_input: Static topography input file of WRF (geo_em.d01). * WRF_27km_NoahMP: Preprocessed WRF output of the simulation run with the WRF using the surface parameterization Noah-MP to reproduce the figures and results in the paper. * WRF_27km_CRYOWRF: Preprocessed WRF output of the simulation run with CRYOWRF to reproduce the figures and results in the paper. * Scripts_Reproducibility: Python scripts to reproduce the figures and results in the paper. Note: * To run some of the scripts Atmospheric Weather station data needs to be prepared using Gerber and Lehning, 2022. * AWS data is not provided and needs to be downloaded from the corresponding databases. Please make sure to comply with the respective terms and conditions.62 years ago
- Compiled data on the impacts of seven important NNTs (Acacia dealbata, Ailanthus altissima, Eucalyptus globulus, Prunus serotina, Pseudotsuga menziesii, Quercus rubra, Robinia pseudoacacia) on physical and chemical soil and biodiversity in Europe, and summarise commonalities and differences. A total of 107 publications considered, studies referred to biodiversity attributes and soil properties: 2804 lines and 30 rows.32 years ago
- This repository contains the source code of the analysis presented in the related paper. The code can be found in the following github repository: https://github.com/Chelmy88/temporal_downscaling This code can be used to perform temporal downscaling of meteorological time series from daily to hourly time steps and to perform the quality assessment described in the paper. This program is free software: you can redistribute it and/or modify it under the terms of the GNU General Public License as published by the Free Software Foundation, either version 3 of the License, or (at your option) any later version.42 years ago
-  LWF plot Beatenberg - Community: Beatenberg / canton BE - Date of installation: 25 September 1996 - Size of the plot: 2 ha - Altitude: 1490-1532 m - Mean slope: 66% - Geology (in German): Helvetikum, Tertiär, Eozän; Hohgantsandstein - Provisional soil type (WSL) : Gleyic Podzols - Woodland association after EK72: 57: Sphagno-Piceetum calamagrostietosum villosae - Main tree species: Picea abies - Management system: high forest - Silvicultural system: selection - Top-height diameter (quadratic average diameter of the 100 thickest trees per ha): 46.4 cm - Number of trees BHD >= 12 cm (2011): 851 - Maximum tree age: Picea abies 190-210 yr More Information: https://www.wsl.ch/en/forest/forest-development-and-monitoring/long-term-forest-ecosystem-research-lwf/sites/beatenberg.html22 years ago
- This research data is used to re includes 1 km resolution seed plant species range maps for the Hengduan mountain region (southwest China), elevation information for each species, family-level plant richness data, and habitat heterogeneity data at both Eurasia and Hengduan mountain regions. This research data includes 1 km resolution seed plant species range maps for the Hengduan mountain region (southwest China), elevation information for each species, family-level plant richness data, and habitat heterogeneity data at both Eurasia and Hengduan mountain regions.52 years ago
- The data was collected on 16.04.2021 and on 28.05.2021 with a Wingtra Gen II and a Sony RX1 II RGB sensor to obtain snow depth and distribution data. Following the data collection, the data was processed with Agisoft Metashape. A 10cm DSM, a 10cm snow depth raster, a 3mm orthophoto and the original drone images are available for download.12 years ago
- The data archive contains site specific geographical data such as DEM and orthophoto as well as the deposition points of manually induced rockfall by releasing differently shaped boulders with 46, 200, 800 and 2670 kg of mass. Additionally available are all the reconstructed data sets for all trajectories with videogrammetry installed comprising StoneNode data streams for rocks equipped with a sensor. The data set consists of: # Resources (individual zip-archives) __ExperimentalRuns__: Archive with all available StoneNode data streams and its respective figure (.mat files) __Input__: Archive containing folders * GNSS: 182 Deposition points of all different weight and shape classes, shape files for release point, cliff and scree line, * UAS: UAS generated pre- and post-experimental digital surface models and orthophoto of the four most important experimental days and * VG_Coord: Reconstruction input: Videogrammetry based coordinate list along side with the corresponding sensor/video times __EOTA__: Point cloud of cubic EOTA(111) and platy EOTA(221) rock as input for RAMMS::ROCKFALL or other suitable rockfall simulation codes incorporating complex shape files. __Output__: Reconstruced trajectory information for all 82 reconstructed trajectories __Video__: available video streams for all runs ## Further information Preceeding publications concering the deployed sensors and the reconstruction methods are found in the subsequent references: A. Caviezel et al., Design and Evaluation of a Low-Power Sensor Device for Induced Rockfall Experiments, IEEE Transactions on Instrumentation and Measurement, 2018, 67, 767-779, http://ieeexplore.ieee.org/document/8122020/ P. Niklaus et al., StoneNode: A low-power sensor device for induced rockfall experiments, 2017 IEEE Sensors Applications Symposium (SAS), 2017, 1-6, http://ieeexplore.ieee.org/document/7894081/ Caviezel, A., Demmel, S. E., Ringenbach, A., Bühler, Y., Lu, G., Christen, M., Dinneen, C. E., Eberhard, L. A., von Rickenbach, D., and Bartelt, P.: Reconstruction of four-dimensional rockfall trajectories using remote sensing and rock-based accelerometers and gyroscopes, Earth Surf. Dynam., 7, 199–210, https://doi.org/10.5194/esurf-7-199-2019, 201952 years ago
- We investigated the sensitivity of modeled snow instability to meteorological input data using SNOWPACK. We therefore used input data from the automatic weather station at the Weissfluhjoch field site for the year 2016-2017. We investigated three scenarios and performed 14'000 simulations for each scenario. The dataset contains extracted output data from modeled SNOWPACK simulations, including setup files to reproduce the simulations. For further information read the README file.52 years ago
- The dataset contains individual genotypes at 11 nuclear microsatellite markers of samples of Swiss stone pine (*Pinus cembra*). Samples were collected in 12 natural and presumably planted stands in the canton of Fribourg (Switzerland). The dataset is complemented by individual genotypes (same markers) from samples of a subset of 40 populations across the European Alps (taken from Gugerli et al., Journal of Biogeography 2023; https://doi.org/10.1111/jbi.14586; dataset archived at Dryad, https://doi.org/10.5061/dryad.866t1g1v6).52 years ago
- # 191# Number of regeneration trees starting at 10 cm tall up to 11.9 cm dbh recorded in NFI’s regeneration survey. __Citation:__ > _Abegg, M.; Brändli, U.-B.; Cioldi, F.; Fischer, C.; Herold-Bonardi, A.; Huber M.; Keller, M.; Meile, R.; Rösler, E.; Speich, S.; Traub, B.; Vidondo, B. (2014). Fourth national forest inventory - result tables and maps on the Internet for the NFI 2009-2013 (NFI4b). [Published online 06.11.2014] Available from World Wide Web http://www.lfi.ch/resultate/ Birmensdorf, Swiss Federal Research Institute WSL. [doi:10.21258/1057112](https://doi.org/10.21258/1057112)_22 years ago
- In 2013, the Institute for Applied Plant Biology (IAP) started a monitoring programme to study the development and the spatial variation of the ash dieback disease with the aim to find some partially resistant European ash trees (Fraxinus excelsior). We collaborate as co-authors for the publication: Spread and Severity of Ash Dieback in Switzerland - Tree Characteristics and Landscape Features Explain Varying Mortality Probability (Klesse et al. 2021 in frontiers)12 years ago
- High quality meteorological data are needed for long-term forest ecosystem research, particularly in the light of global change. The long-term data series published here comprises almost 20 years of measurements for two meteorological stations in Othmarsingen in Switzerland where one station is located within a natural deciduous forest stand (OTB) with European beech (_Fagus sylvatica_; 120-140 yrs) and lime trees (_Tilia sp._; 120-140 yrs) as dominant tree species. A second station is situated in the very vicinity outside of the forest (field station, OTF). The meteorological time series are presented in hourly time resolution of air temperature, relative humidity, precipitation, photosynthetically active radiation (PAR) and wind speed. Othmarsingen is part of the Long-term Forest Ecosystem Research Programme (LWF) established and maintained by the Swiss Federal Research Institute WSL.72 years ago
- Index based on the number of tree and shrub species starting at 12 cm dbh in the upper layer and the occurrence of especially ecologically valuable tree and shrub species starting at 12 cm dbh in the upper layer. __Citation:__ > _Abegg, M.; Brändli, U.-B.; Cioldi, F.; Fischer, C.; Herold-Bonardi, A.; Huber M.; Keller, M.; Meile, R.; Rösler, E.; Speich, S.; Traub, B.; Vidondo, B. (2014). Fourth national forest inventory - result tables and maps on the Internet for the NFI 2009-2013 (NFI4b). [Published online 06.11.2014] Available from World Wide Web http://www.lfi.ch/resultate/ Birmensdorf, Swiss Federal Research Institute WSL. [doi:10.21258/1057112](https://doi.org/10.21258/1057112)_42 years ago
- This is the source code to compute rainfall thresholds for debris flows or landslides following Hirschberg et al. (2021). ## How to install and run the example Pyhton has to be installed to run the codes. To make sure it works correctly, it is easiest to install Anaconda and create an environment with the right packages from the yml-file. To this end, in a command-line interpreter, change the working directory to where you saved this project and run the following: `$ conda env create -f environment.yml` `$ conda activate thresholds` or `$ source activate thresholds` To run an example: `$ python run_example()` It will save a dat-file and a figure as Fig. 7 in Hirschberg et al. (2021), where more information can be found. ## License GNU General Public License v3.012 years ago
- There are many sources providing atmospheric weather station data for the Antarctic continent. However, variable naming, timestamps and data types are highly variable between the different sources. The published python code intends to make processing of different AWS sources from Antarctica easier. For all datasets that are taken into account variables are renamed in a consistent way. Data from different sources can then be handled in one consistent python dictionary. The following data sources are taken into account: * AAD: Australian Antarctic Division (https://data.aad.gov.au/aws) * ACECRC: Antarctic Climate and Ecosystems Cooperative Research Centre by the Australian Antarctic Division * AMRC: Antarctic Meteorological Research Center (ftp://amrc.ssec.wisc.edu/pub/aws/q1h/) * BAS: British Antarctic Survey (ftp://ftp.bas.ac.uk/src/ANTARCTIC_METEOROLOGICAL_DATA/AWS/; https://legacy.bas.ac.uk/met/READER/ANTARCTIC_METEOROLOGICAL_DATA/) * CLIMANTARTIDE: Antarctic Meteo-Climatological Observatory by the italian National Programme of Antarctic Research (https://www.climantartide.it/dataaccess/index.php?lang=en) * IMAU: Institute for Marine and Atmospheric research Utrecht (Lazzara et al., 2012), https://www.projects.science.uu.nl/iceclimate/aws/antarctica.ph * JMA: Japan Meteorological Agency (https://www.data.jma.go.jp/antarctic/datareport/index-e.html) * NOAA: National Oceanic and Atmospheric Administration (https://gml.noaa.gov/aftp/data/meteorology/in-situ/spo/) * Other/AWS_PE: Princess Elisabeth (PE), KU Leuven, Prof. N. van Lipzig, personal communication * Other/DDU_transect: Stations D-17 and D-47 (in transect between Dumont d’Urville and Dome C, Amory, 2020) * PANGAEA: World Data Center (e.g. König-Langlo, 2012) __Important notes __ * __Information about data sources is available. Some downloading scripts are included in the provided code. However, users should make sure to comply with the data providers terms and conditions.__ * Given changing download options of the differnent institutions the above links may not permanently work and data has to be retrieved by the user of this dataset. * No quality control is applied in the provided preprocessing software - quality control is up to the user of the datasets. Some dataset are quality controlled by the owner. Acknowledgements -------------------------- We thank all the data providers for making the data publicly available or providing them upon request. Full acknowledgements can be found in Gerber et al., submitted. References --------------- Amory, C. (2020). “Drifting-snow statistics from multiple-year autonomous measurements in Adélie Land, East Antarctica”. The Cryosphere, 1713–1725. doi: 10.5194/tc-14-1713-2020 Gerber, F., Sharma, V. and Lehning, M.: CRYOWRF - a validation and the effect of blowing snow on the Antarctic SMB, JGR - Atmospheres, submitted. König-Langlo, G. (2012). “Continuous meteorological observations at Neumayer station (2011-01)”. Alfred Wegener Institute, Helmholtz Centre for Polar and Marine Research, Bremerhaven, PANGAEA, doi: 10.1594/PANGAEA. 77517312 years ago
- Annual Crown Condition Assessment including mortality and removal and Damage Causse Assessment on the Sanasilva-Sites and LWF plots. ### Purpose: ### To assess tree and forest health and its changes and to assess occurence and extent of diseases ### Manual Citation: ### * Matthias Dobbertin, Christian Hug, Andreas Schwyzer, Serge Borer, Hanna Schmalz, 2016: Aufnahmeanleitung Kronenansprachen auf den Sanasilva- und den LWF-Flächen (Version 10). Sanasilva Inventur und Langfristige Waldökosystem-Forschung, Birmensdorf, 86 S. [>>>](https://www.wsl.ch/fileadmin/user_upload/WSL/Wald/Waldentwicklung_Monitoring/LWF/Sanasilva/ssi_anleitung_v10_extern.pdf) * Eichhorn J, Roskams P, Potocic N, Timmermann V, Ferretti M, Mues V, Szepesi A, Durrant D, Seletkovic I, Schröck H-W, Nevalainen S, Bussotti F, Garcia P, Wulff S, 2016: Part IV: Visual Assessment of Crown Condition and Damaging Agents. In: UNECE ICP Forests Programme Co-ordinating Centre (ed.): Manual on methods and criteria for harmonized sampling, assessment, monitoring and analysis of the effects of air pollution on forests. Thünen Institute of Forest Ecosystems, Eberswalde, Germany, 49 p. + Annex [>>>](https://www.icp-forests.org/pdf/manual/2016/ICP_Manual_2017_02_part04.pdf ) ### Paper Citation: ### * BAFU (2017) Jahrbuch Wald und Holz 2017. Umwelt-Zustand, Bundesamt für Umwelt, Bern, Vol. 1718: 110 p. [>>>](http://www.bafu.admin.ch/uz-1718-d) * Michel A, Seidling W, Prescher A K (2018) Forest Condition in Europe. 2018 Technical Report of ICP Forests. Report under the UNECE Convention on Long-Range Transboundary Air Pollution (CLRTAP). BFW-Dokumentation 25/2018, BFW Austrian Research Centre for Forests, Vienna, 92 p. [Technical Reports](http://icp-forests.net/page/icp-forests-technical-report) * Brang P., 1998: Sanasilva-Bericht 1997. Zustand und Gefährdung des Schweizer Waldes – eine Zwischenbilanz nach 15 Jahren Waldschadenforschung. Berichte der Eidg. Forschungsanstalt für Wald, Schnee und Landschaft, Vol. 345. Eidg. Forschungsanstalt WSL, Birmensdorf, 102 S. [>>>](https://www.dora.lib4ri.ch/wsl/islandora/object/wsl:14555)12 years ago
- Volume of stemwood with bark of all trees and shrubs starting at 12 cm dbh that died or disappeared between two inventories, but were not cut. *In the calculation no D7/tree height data were used. The values calculated like this have not been corrected for bias, but allow for cantons or forest districts a more robust estimation of changes and could thus be better interpreted. __Citation:__ > _Abegg, M.; Brändli, U.-B.; Cioldi, F.; Fischer, C.; Herold-Bonardi, A.; Huber M.; Keller, M.; Meile, R.; Rösler, E.; Speich, S.; Traub, B.; Vidondo, B. (2014). Fourth national forest inventory - result tables and maps on the Internet for the NFI 2009-2013 (NFI4b). [Published online 06.11.2014] Available from World Wide Web http://www.lfi.ch/resultate/ Birmensdorf, Swiss Federal Research Institute WSL. [doi:10.21258/1057112](https://doi.org/10.21258/1057112)_22 years ago
- This dataset contains all data on which the following publication below is based. Paper Citation: Guidi, C., Lehmann, M.M., Meusburger, K., Saurer, M., Vitali, V., Peter, M., Brunner, I., Hagedorn, F. (accepted). Tracing sources and turnover of soil organic matter in a long-term irrigated dry forest using a novel hydrogen isotope approach. Soil Biology and Biochemistry. Please cite this paper together with the citation for the datafile. Data from a 17-year-long irrigation experiment (Pfynwald, Switzerland) in a naturally dry forest dominated by 100-year-old pine trees (Pinus sylvestris). Data include: (1) Isotopic composition (stable isotope ratios of non-exchangeable hydrogen δ2Hn, carbon δ13C, and nitrogen δ15N) and Hn, C and N concentrations in SOM sources (fresh Pinus sylvestris needles, litter layer, fine roots), bulk SOM (organic layer, 0-2 cm, 2-5 cm, 60-80 cm), particle-size fractions (depths: 0-2 cm, 2-5 cm; cPOM: coarse POM; fPOM: fine POM; MOM: mineral-associated organic matter); (2) Mass loss, δ2Hn values and Hn concentrations of Pinus sylvestris fine roots and needle litter (litter decomposition experiments from Herzog et al. 2019, ISME journal, and Guidi et al. 2022, Global Change Biology); (3) Relative source contribution (foliar litter, fine roots, and mycelia) to bulk SOM and fractions estimated using Bayesian mixing models (R package MixSIAR, version 3.1.12) with irrigation and depth as fixed factors. The models were informed with δ13C, δ15N and δ2Hn values and C, N, and Hn concentrations of foliar litter, roots, and mycelia as input sources. Given the kinetic isotope fractionation occurring during microbial SOM decomposition, the mixing models were informed with isotope fractionation factors, representing the isotope enrichment from sources to soils; (4) Fraction of new organic Hn (Fnew) over the irrigation period, calculated using a simple end-member mixing model according to Balesdent et al. (1987) and mean residence time estimated as MRT = - t / ln (1 - Fnew), with t time in years since irrigation started and assuming single-pool model with first-order kinetics.12 years ago
- The files refer to the data used in Portier et al. "‘Latent reserves’: a hidden treasure in National Forest Inventories" (2020) *Journal of Ecology*. **'Latent reserves'** are defined as plots in National Forest Inventories (NFI) that have been free of human influence for >40 to >70 years. They can be used to investigate and acquire a deeper understanding of attributes and processes of near-natural forests using existing long-term data. To determine which NFI sample plots could be considered ‘latent reserves’, criteria were defined based on the information available in the Swiss NFI database: * Shrub forests were excluded. * Plots must have been free of any kind of management, including salvage logging or sanitary cuts, for a minimum amount of time. Thresholds of 40, 50, 60 and 70 years without intervention were tested. * To ensure that species composition was not influenced by past management, plots where potential vegetation was classified as deciduous by Ellenberg & Klötzli (1972) had to have an observed proportion of deciduous trees matching the theoretical proportion expected in a natural deciduous forest, as defined by Kienast, Brzeziecki, & Wildi (1994). * Plots had to originate from natural regeneration. * Intensive livestock grazing must never have occurred on the plots. The tables stored here were derived from the first, second and third campaigns of the Swiss NFI. The raw data from the Swiss NFI can be provided free of charge within the scope of a contractual agreement (http://www.lfi.ch/dienstleist/daten-en.php). **** The files 'Data figure 2' to 'Data figure 8' are publicly available and contain the data used to produce the figures published in the paper. The files 'Plot-level data for characterisation of 'latent reserves' and 'Tree-level data for characterisation of 'latent reserves' contain all the data required to reproduce the section of the article concerning the characterisation of 'latent reserves' and the comparison to managed forests. The file 'Data for mortality analyses' contains the data required to reproduce the section of the article concerning tree mortality in 'latent reserves'. The access to these three files is restricted as they contain some raw data from the Swiss NFI, submitted to the Swiss law and only accessible upon contractual agreement.102 years ago
- The data set contains the re-analyzed (or quality-checked) regional avalanche danger levels (D_QC) for Switzerland. D_QC relates to dry-snow avalanche conditions only. Measuring the avalanche danger level D is not possible; forecast, nowcast, and hindcast assessments of D are judgments by humans interpreting data. However, combining several pieces of information indicating the same D, it can be expected that it is more likely that D_QC represents the avalanche conditions well. For the **forecasting seasons 2001/2002 until 2019/2020**, the approach to obtain D_QC is described in detail in Appendix A of [Pérez-Guillén et. al. (2022)](https://nhess.copernicus.org/articles/22/2031/2022/nhess-22-2031-2022.html). For the **forecasting seasons 2020/2021 and later**, D_QC is derived using the following approach: 1. *Combination of forecast (D_forecast) and nowcast (D_nowcast)*: If there was only one assessment available by an observer after a day in the field for a region, and if D_forecast = D_nowcast --> D_QC = D_forecast. 2. *Combination of several nowcast assessments (D_nowcast)*: If two (or more) observers agreed (or majority opinion) in their (independent) assessments of D_nowcast after a day in the field in the same warning region. --> D_QC = D_nowcast. 3. *Hindcast analysis (D_hindcast)*: In Switzerland, avalanche forecasters re-evaluate all situations when D = 4 (high) or D = 5 (very high) were either forecast, should have been forecast, or when forecasters discussed given one of these two levels but had not given them. Generally, two forecasters assess each situation. In these cases, D_QC = D_hindcast. The hindcast analysis, only available since the forecasting season 2020/2021, replaces what was step (2) in Appendix A of [Pérez-Guillén et. al. (2022)](https://nhess.copernicus.org/articles/22/2031/2022/nhess-22-2031-2022.html). All other cases - ties in case of (1) or (2), no new information from the warning region in question, or if no D_hindcast was available - are not considered quality-checked, and are, thus, not contained in the data set. In addition to D_QC, the file contains information on the elevation and aspect, where D_QC likely prevails. - The indicated elevation is the mean of the respective elevations in (1), (2), or (3). At danger level 1 (low), when no elevation is indicated in the Swiss forecast, a value of 1500 m is set. - For the four cardinal aspects N, E, S, and W, a value of 1 means that there was agreement that D was reached in this aspect and a value of 0 means that there was agreement that D was not reached in this aspect. Intermediate values correspondingly mark disagreements in the assessments.22 years ago
- The study of ecological networks along environmental gradients has so far been limited by the difficulty of collecting large-scale dataset of comparable interactions. Here, we compiled 48 plant–orthoptera interaction networks at multiple locations across the Swiss Alps (i.e. along six elevation gradient). Trophic interactions were obtained by applying next-generation sequencing methods (e.g. DNA metabarcoding) on insect feces. Together with interaction data, we also provide data of the functional trait measurement (i.e. plant leaves traits and insect mandibular strength) expected to influence the realization of the interaction. Species inventories, feces samples and functionals traits were collected during the summer 2016 and 2017. Lab work and network reconstruction were completed in 2019.62 years ago
- The RADAR wind profiler from Meteoswiss was installed at Davos Wolfgang (LON: 9.853594, LAT: 46.835577) and measured from 2171 m above sea level to 11079 m, with a temporal resolution of 10 minutes.12 years ago
- Forest monitoring to assess forest functioning under air pollution and climate change. Proceedings. FORECOMON 2021 - the 9th forest ecosystem monitoring conference. 7-9 June 2021, WSL, Birmensdorf, Switzerland The goal of FORECOMON 2021 is to highlight the extensive ICP Forests data series on forest growth, phenology and leaf area index, biodiversity and ground vegetation, foliage and litter fall, ambient air quality, deposition, meteorology, soil and crown condition. We combine novel modeling and assessment approaches and integrate long-term trends to assess air pollution and climate effects on European forests and related ecosystem services. Latest results and conclusions from local scale to European scale studies will be presented and discussed. Copyright © 2021 by WSL, Birmensdorf The authors are responsible for the content of their contribution.32 years ago
- This dataset contains the road and plot data used for the geospatial analysis example showcased in "Fostering Open Science at WSL with the EnviDat Environmental Data Portal", a contribution to the 5th Open Source Geospatial Research and Education Symposium (OGRS), 2018. The example uses Jupyter Notebook to calculate road densities in the neighbourhood of sample plot locations with Python. Road data were extracted from OpenStreetMap, while the point data (sample plots) were generated manually.42 years ago
- We recorded snow ablation maps with a terrestrial laser scanner (TLS, Riegl-VZ6000) at the Gletschboden area. The TLS position is located approximately 30 vertical meters above the Gletschboden area at a northerly exposed slope. In total 44 TLS measurement sets have been conducted in three consecutive years 2014-2016 (2014: 13 measurements; 2015: 17 measurements; 2016: 14 measurements). The TLS system has a single-point measurement frequency of 300 kHz and a beam divergence of 0.007°. This set-up allows a horizontal resolution of approximately 0.01 m in 100 m distance to the TLS position. One scan of the Gletschboden area lasts approximately 15 minutes. The travel time from the laser scanner towards the surface is recorded and afterwards converted into a point cloud of distances. 5 reflectors located at the Gletschboden area and in the closer surroundings were additionally scanned during each measurement to transform the point cloud from the scanner own coordinate system into Swiss coordinates. Additionally, orthophotos have been created by using pictures recorded from the TLS in order to provide snow mask maps. Snow and bare ground can be distinguished by the RGB color information of the orthophoto. Cells with blue band information greater than 175 were categorized as snow and all cells with values smaller or equal 175 were categorized as bare ground.72 years ago
- Ziel dieses Whitepapers ist es, Entscheidungsträgern, Verwaltungen und Stakeholdern die aktuellsten Forschungsergebnisse zur Verfügung zu stellen, um die optimale Nutzung von Bioenergie aus Hofdünger in der Schweizer Energiewende zu fördern. Zu diesem Zweck werden die Ergebnisse des Schweizer Kompetenzzentrums für Bioenergieforschung - SCCER BIOSWEET - zusammengefasst und in einem breiteren Kontext dargestellt. Wenn nichts anderes erwähnt wird, beziehen sich die Ergebnisse auf die Schweiz und im Falle der Ressourcen auf die heimischen Biomassepotenziale.12 years ago
- Daily discharge and the related hydro-meteorological variables precipitation, snowmelt, and soil moisture are provided for current (1981-2017) and for future climate conditions (1981-2100) for 307 medium-sized catchments in Switzerland. The catchments have a median catchment area of 117 km². The 307 catchments together form a set representative of the climatological conditions and runoff characteristics in Switzerland. The four variables were simulated at a daily resolution using the hydrological model PREVAH. PREVAH is a conceptual process-based model that was run in this study in its fully distributed version on a 500 m grid (Viviroli et al. 2009a). For the calibration, runoff time series from 140 mesoscale catchments covering the different runoff regimes were used. The model calibration was conducted over the period 1993-1997. Verification was performed on the period 1983-2005 using (i) volumetric deviation (Viviroli et al. 2007) and (ii) benchmark efficiency (Schäfli et al 2007) as objective functions. The calibration and validation procedures are described in detail in Köplin et al. (2010). The parameters for each model grid cell were derived by regionalizing the parameters obtained for the 140 catchments with a procedure based on ordinary kriging (Viviroli et al. 2009b, Köplin et al. 2010). The calibrated and validated model was then driven with transient meteorological data (precipitation, temperature, radiation, and wind) representing both reference (1981-2017) and future climate conditions (2018-2099). The data were derived from the CH2018 climate scenarios (NCCS 2018) provided by the Swiss National Centre for Climate Services (NCCS). They were obtained from climate experiments produced with different climate modeling chains, consisting of a global and a regional circulation model each, within EUROCORDEX for three representative concentration pathways (RCP) emission scenarios. Downscaled output of ten climate model chains derived by quantile mapping were considered. The focus was on the chains of the EUR-11 domain with a horizontal resolution of 0.11 degrees (roughly 12.5 km). The climate model chains (GCM, RCM, RCP, and grid resolution) used are listed below: - ICHEC-EC-EARTH DMI-HIRHAM5 2.6 EUR-11 - ICHEC-EC-EARTH DMI-HIRHAM5 4.5 EUR-11 - ICHEC-EC-EARTH DMI-HIRHAM5 8.5 EUR-11 - ICHEC-EC-EARTH SMHI-RCA4 2.6 EUR-11 - ICHEC-EC-EARTH SMHI-RCA4 4.5 EUR-11 - ICHEC-EC-EARTH SMHI-RCA4 8.5 EUR-11 - MOHC-HadGEM2-ES SMHI-RCA4 4.5 EUR-11 - MOHC-HadGEM2-ES SMHI-RCA4 8.5 EUR-11 - MPI-M-MPI-ESM-LR SMHI-RCA4 4.5 EUR-11 - MPI-M-MPI-ESM-LR SMHI-RCA4 8.5 EUR-11 __*References*__: - Köplin, N., D. Viviroli, B. Schädler, and R. Weingartner (2010), _How does climate change affect mesoscale catchments in Switzerland? - A framework for a comprehensive assessment_, Advances in Geosciences, 27, 111-119, doi:10.5194/adgeo-27-111-2010. - National Centre for Climate Services (2018), CH2018 - _Climate Scenarios for Switzerland_, Tech. rep., NCCS, Zurich. - Schäfli, B., and H. V. Gupta (2007), _Do Nash values have value?_, Hydrological Processes, 21, 2075-2080, doi:10.1002/hyp.6825. - Viviroli, D., J. Gurtz, and M. Zappa (2007), _The hydrological modelling system PREVAH. Part II - Physical model description_, Geographica Bernensia, 40, 1-89. - Viviroli, D., M. Zappa, J. Gurtz, and R. Weingartner (2009a), _An introduction to the hydrological modelling system PREVAH and its pre- and post-processing-tools_, Environmental Modelling & Software, 24, 1209-1222, doi:10.1016/j.envsoft.2009.04.001. - Viviroli, D., H. Mittelbach, J. Gurtz, and R. Weingartner (2009b), _Continuous simulation for flood estimation in ungauged mesoscale catchments of Switzerland-Part II: Parameter regionalisation and flood estimation results_, Journal of Hydrology, 377 (1), 208-225, doi:10.1016/j.jhydrol.2009.08.022.32 years ago
- Data obtained in the free-air CO2 enrichment (FACE) experiment at Hofstetten, NW Switzerland, between 2009 and 2016. This dataset contains analyses of the soil solution throughout the experiment, especially for nitrate, as well as different analyses done at the end of the experiment: ammonium and nitrate captured by ion-exchange resin bags and extracted from soil cores, gross N mineralisation and nitrification measured by isotope dilution.62 years ago
- This dataset contains the results obtained by an automatic classification using hidden Markov models of a continuous seismic dataset. To avoid long computational times, we reduced the seismic data using pre-processing step. The start and end times of the windows used for the classification are also included in this dataset. Furthermore, an avalanche reference data set is included and the python scripts used to perform the processing steps and the classification.12 years ago
- In summer 2014, 6 rock blocks between 20 and 80kg have been thrown in total 111 times down a slope at the Swiss Oberalppass close to the village Tschamut. The slope was mainly covered by grass and its lower part was flat and large enough to provide natural runouts of the single trajectories. An extensive measurement program has been set up to measure the block trajectories: With surveyor's instruments the slope and the six used rock blocks were scanned and the start and end positions of each test were recorded. During the single events two cameras filmed the trajectories. A special sensor device located within the blocks recorded the acting accelerations and rotational speeds over time. Further, the device emitted a Wifi signal that got detected from eight receivers around the slope. Based on this signal the block position has been recorded over time. The dataset contains all data that were gathered through above field campaign.42 years ago
- Assessment of coarse woody debris on LWF plots using the line intersect method (repetition of the 1995 survey) ### Purpose: ### Assessing the amount of coarse woody debris ### Manual Citation: ### * Matthias Dobbertin, Nathalie Bretz Guby, 1997: Totholz. In: Peter Brang (ed.) LWF Aufnahmeanleitung. Langfristige Waldökosystem-Forschung LWF, Eidg. Forschungsanstalt WSL, Birmensdorf, 5 S.12 years ago
- Aim of this white paper is to provide decision-makers, administrations and stakeholders with the most current research findings in order to promote the optimal use of bioenergy from manure in the Swiss energy transition. For this purpose, the results of the Swiss competence center for bioenergy research - SCCER BIOSWEET - are summarized and presented in a broader context. If nothing else is mentioned, the results refer to Switzerland and in case of the feedstock to the domestic biomass potentials.12 years ago
- The data presented here corresponds to the publication "Spatial variability in snow precipitation and accumulation in COSMO-WRF simulations and radar estimations over complex terrain" (Gerber et al., 2018a), which investigates the precipitation variability of snow precipitation in the central northern part of the Grisons (CH) and the publication "The importance of near-surface winter precipitation processes in complex alpine terrain" (Gerber et al., 2018b). The dataset contains: * WRFsimulations: WRF simulation output for simulations with 4x (14x) terrain smoothing with an output timestep of 30 min/5 min and horizontal grid spacings of 1350 m, 450 m, 150 m and 50 m (currently: data available upon request). * StationData: Meteorological station data of 18 meteorological stations in the central northern part of the Grisons with 30 minute resolution for the period 1 January 2016 till 1 May 2016. * ADS80data: Photogrammetrically determined snow depth distribution data over the Dischma valley for the 26 January 2016 and 9 March 2016. Snow heights are corrected for buildings, vegetation (> 1m), outliers, and pixles, which are obivously snow-free on the pictures (Bühler et al., 2015). In addition the snow depth differences (snow depth on 9 March 2016 minus snow depth on 26 January 2016) are provided. For more details about the simulation and observation data, see Gerber et al., 2018 and Gerber and Sharma (2018). __Publications:__ Bühler, Y., Marty, M., Egli, L., Veitinger, J., Jonas, T., Thee, P., and Ginzler, C.: Snow depth mapping in high-alpine catchments using digital photogrammetry. Cryosphere, 9, 229–243, doi:10.5194/tc-9-229-2015, 2015. Gerber, F., Besic, N., Sharma, V., Mott, R., Daniels, M., Gabella, M., Berne, A., Germann, U., and Lehning, M.: Spatial variability in snow precipitation and accumulation in COSMO-WRF simulations and radar estimations over complex terrain, The Cryosphere, 12, 3137–3160, doi:10.5194/tc-12-3137-2018, 2018. Gerber, F., Mott, R. and Lehning, M.: The importance of near-surface winter precipitation processes in complex alpine terrain, Journal of Hydrometeorology, accepted, 2018. Gerber, F., and Sharma, V.: Running COSMO-WRF on very-high resolution over complex terrain. Laboratory of Cryospheric Sciences CRYOS, École Polytechnique Fédérale de Lausanne EPFL, Lausanne, Switzerland. doi:10.16904/envidat.35, 2018.22 years ago
- This dataset contains all data and R codes (R Development Core Team, https://www.R-project.org) used in the following publication: Donati GFA, Parravicini V, Leprieur F, Hagen O, Gaboriau T, Heine C, Kulbicki M, Rolland J, Salamin N, Albouy C, Pellissier L. "A process-based model supports an association between dispersal and the prevalence of species traits in tropical reef fish assemblages" accepted by Ecography in August 2019. When using this data and R scripts the above publication should be cited. The interaction of habitat dynamics with species dispersal abilities could generate gradients in species diversity and prevalence of life-history and ecological traits, when the latter are associated with dispersal potential. In this dataset, we use a spatial mechanistic model of speciation, extinction and dispersal, constrained by a dispersal parameter. This model allows to simulate the interplay between reef habitat dynamics over the past 140 million years and dispersal, shaping lineage diversification history and global assemblage composition of over 6000 tropical reef fish species. Global trait distribution data of tropical reef fish are used to evaluate the congruence between simulations and observations.132 years ago
- This dataset contains four years of daily measurements of the natural isotopic composition (2H, 18O) of precipitation and stream water at the Alp catchment (area 47 km2) in Central Switzerland and two of its tributaries (0.73 km2 and 1.55 km2). In addition, the dataset contains daily measurements of key hydrometeorological variables.42 years ago
- The dataset contains data from a survey, which was conducted in a periurban region close to Berne, Switzerland. The survey was conducted in Fall 2018 and contained opinion questions about the energy transition. Additionally, spatial data was collected using a PPGIS. While the opinion data is included in the data set, the spatial data is not. For more explanation, please consider the information sheet, the related publications or to contact the authors.22 years ago
- The Stand Density Index (SDI) is a general measure for the density of a stocking and is based on the number of stems/ha and the average diameter of the tally trees on the sample plot. __Citation:__ > _Abegg, M.; Brändli, U.-B.; Cioldi, F.; Fischer, C.; Herold-Bonardi, A.; Huber M.; Keller, M.; Meile, R.; Rösler, E.; Speich, S.; Traub, B.; Vidondo, B. (2014). Fourth national forest inventory - result tables and maps on the Internet for the NFI 2009-2013 (NFI4b). [Published online 06.11.2014] Available from World Wide Web http://www.lfi.ch/resultate/ Birmensdorf, Swiss Federal Research Institute WSL. [doi:10.21258/1057112](https://doi.org/10.21258/1057112)_42 years ago
- Data accompanying David Wagners' Dissertation. Covers model results and various input from ALPINE3D and SNOWPACK adjusted for sea ice during MOSAiC.22 years ago
- Avalanche problem types were derived from snow cover simulations with the models Crocus and SNOWPACK at the Weissfluhjoch study plot, Davos, CH. The data include annual frequencies of avalanche problem types for the seasons 1999-2017 and daily presence of avalanche problem types for the period 01.01.2016 - 30.04.2016. Avalanche activity was derived from two seismic sensor arrays deployed no further than 15 km from Weissfluhjoch, Davos, CH. The data cover the period 01.01.2016 - 30.04.2016.52 years ago
- This dataset includes data from 15 native pond breeding species in Switzerland in addition to observations of any species within the Pelophylax genus of water frogs. 233 sites (obnr) sampled during the 2011-2016 round of the WBS survey, which are listed as the "first" round of surveys. Data are also provided at 73 sites which were resurveyed in 2017 or 2018 ("second" surveyround). The data are filtered as described in Cruickshank et al. (2021) to remove data from surveys carried out after the final sighting of a species within a year, and before the first observation of the species within a year. Observational data are provided as one of 3 observation types; 1 denotes a survey where the species was not detected, 2 denotes surveys where the species was detected but no life stages indicating successful breeding (e.g. the presence of eggs or larvae) were observed. Observation type 3 denotes a survey where evidence of successful breeding was observed (i.e. eggs or larvae). Survey protocols and full descriptions of the data are provided in Cruickshank et al (2021).12 years ago
- Aerosol properties were measured between February 8 and March 31 2019 at the measurement site Weissfluhjoch (LON: 9.806475, LAT: 46.832964). Optical and aerodynamic particle counters, as well as a scanning mobility particle size spectrometer and an ice nuclei counter were deployed to report particle concentrations and size distributions in fine (10-1000 nm) and coarse mode (> 1000 nm), cloud condensation nuclei concentrations (CCNCs), and ice nuclei particle concentrations (ICNCs). The ambient particles were transported via a heated inlet to be distributed to the particle detecting devices inside the setup room. Optical Particle Counter (OPC): Light scattering of a diode laser beam caused by travelling particles is used in the both, the OPC-N3 (0.41 - 38.5 μm) and GT-526S (0.3 – 5 μm), to determine their size and number concentration. For the OPC-N3, particle size spectra and concentration data are used afterwards to calculate PM₁, PM₂,₅ and PM₁₀ (assumptions: particle density: 1.65 g cmˉ³, refractive index: 1.5+i0). Aerodynamic Particle Sizer (APS): The APS (3321, TSI Inc.) measured the particle size distribution for aerodynamic diameters between 0.5 μm and ~20 μm by the particle’s time-of-flight and light-scattering intensity (assumptions: particle density 1 g cmˉ³). Scanning Mobility Particle Size Spectrometer (SMPS): Particle number concentrations in a size range between 12 and 460 nm (electrical mobility diameter) were measured at Davos Wolfgang, using a Scanning Mobility Particle Sizer Spectrometer (SMPS 3938, TSI Inc.). The classifier (3082, TSI Inc.) was equipped with a neutralizer (3088, TSI Inc.) and a differential mobility analyzer working with negative polarity (3081, TSI Inc.). The size selected particles were counted by a water-based condensation particle counter (3787 TSI Inc.). The TSI AIM software was used to provide particle size distributions by applying multiple charge and diffusion loss corrections (assumptions: particle density 1 g cmˉ³). Coriolis μ and LINDA: A microbial air sampler (Coriolis μ, bertin Instruments) was used to collect airborne particles for investigating their ice nucleating ability with a droplet freezing device. Particles larger than 0.5 μm were drawn with an air flow rate of up to 300 l min‾¹ into the cone and centrifuged into the wall of the cone due to the forming vortex. The liquid sample was transferred into the LED based Ice Nucleation Detection Apparatus (LINDA, University of Basel) to study heterogeneous ice formation (immersion freezing mode) of ambient airborne particles.52 years ago
- Lebensraumkarte der Schweiz/La carte des milieux naturels de Suisse The FOEN funded project ‘Developing a Habitat Map of Switzerland’ conducted at the WSL, has produced a map of Swiss habitats according to the TypoCH classification (Delarze et al. 2015) wall-to-wall across the whole of Switzerland, to at least the classification’s 2nd level of detail (where possible to the 3rd level of detail). The implementation of the Habitat Map of Switzerland is a vector data set, where each polygon of the dataset is classified to one habitat type only. Habitats are mapped through a variety of approaches that can be grouped as either: 1: Derived from the existing Swiss-wide high quality landcover mapping from Swisstopo’s Topographical Landscape Model (TLM), 2: Modelled within the project using Random Forest or Ensemble Modelling techniques to model the spatial distribution of individual habitat types, 3: Combining existing species distribution models to determine habitat types, or 4: Classification with relatively simple rule-sets based on auxiliary spatial datasets, i.e. vegetation height models, the digital terrain model, the normalised difference vegetation index (NDVI) derived from aerial imagery and/or time-series of growing season Sentinel-2 satellite imagery. Further detail on the methodology can be found within the README document.282 years ago
- A landslide testsite dataset related to pore water pressure perturbations on the stability of unsaturated silty sand slopes leading to the initiation and propagation of the shear deformations and eventual rapid mass movements. This project was initiated and led by the Institute of Geotechnical Engineering (IGT) of the Swiss Federal Institute of Technology (ETH Zurich) and was incorporated in a Swiss national (TRAMM) and a European Union (SafeLand) multidisciplinary research project. Field site: The experimental slope is 7.5 m wide by 35 m long, located in the Swiss lowlands on an east facing slope over-looking the river Rhine, at an altitude of ~ 350 masl. Originally there were forestry covertures of circa 80%, heights of 5-20 m. Shrubs up to 1-5 m high and a free herb layer covered ~ 50% of the surface. The average gradient was determined to be from 38° to 43° with a slightly concave surface. The underlying rock consists mainly of Molasse, which is formed by alternate layers of sea deposits under the Tethys Sea (Seawater Molasse) and land deposits (Freshwater Molasse). Several augured samples, as well as an outcrop of the bedrock about 20 m above the selected field, revealed horizontal layering of fine grained sand- and marlstone at the test site. The sandstone was later proven to be highly permeable and fissured. Grain-size distributions were determined and the soil was classified as medium-low plasticity silty sand. Site instrumentation:Measurements of soil suction, groundwater level, soil volumetric water content, rain intensity and soil temperature were taken and combined with geophysical monitoring using Electrical Resistance Tomography (ERT) and investigations into subsurface flow by means of tracer experiments. Deformations were monitored during the experiment, both on the surface via photogrammetrical methods and within the soil mass, using a flexible probe equipped with strain gauges at different points and two axis inclinometers on the top and acoustic sensors. Instruments were installed mainly in three clusters at depths of 15, 30, 60, 90, 120, and 150 cm below the ground surface over the slope, including jet-fill tensiometers, TDRs, Decagon TDRs, piezometers, soil temperature sensors, deformation probes, earth pressure cells, acoustic sensors and rain gauges. A ring-net barrier (provided by Geobrugg AG) was set up at the foot of the slope to protect the road. Experiments: A sprinkling experiment was carried out in September 2008 to investigate the hydrological and mechanical response of the slope (Experiment 1), followed by a second one to trigger a landslide in March 2009 (Experiment 2). __Publications__ 1. Lehmann, P., F. Gambazzi, B. Suski, L. Baron, A. Askarinejad, S. M. Springman, K. Holliger, and D. Or (2013), Evolution of soil wetting patterns preceding a hydrologically induced landslide inferred from electrical resistivity survey and point measurements of volumetric water content and pore water pressure, Water Resour. Res., 49, 7992–8004, doi:[10.1002/2013WR014560](http://dx.doi.org/10.1002/2013WR014560). 2. Springman, S. M., Kienzler, P., Casini, F., & Askarinejad, A. (2009). Landslide triggering experiment in a steep forested slope in Switzerland. In 17th International Conference of Soil Mechanics and Geotechnical Engineering, Alexandria, Egypt (pp. 1698-1701). doi: [10.3233/978-1-60750-031-5-1698](http://dx.doi.org/10.3233/978-1-60750-031-5-1698)12 years ago
-  LWF Plot Chironico - Community: Chironico / canton TI - Date of installation: 29 August 1995 - Size of the plot: 2 ha - Altitude: 1342-1387 m - Mean slope: 35% - Geology (in German): Untergrund: Penninikum; Paragneisse u. Glimmerschiefer - Oberfläche: Quartär; karbonatfreie Moräne, Hängeschutt - Provisional soil type (WSL) : Distric Cambisol - Woodland association after EK72: 47: Calamagrostio villosae-Abietetum - Main tree species: Picea abies - Management system: high forest - Silvicultural system: group selection - Top-height diameter (quadratic average diameter of the 100 thickest trees per ha): 54.1 cm - Number of trees BHD >= 12 cm (2011): 750 - Maximum tree age: Picea abies: 160-180 yr - Abies alba: 140-160 yr More Information: https://www.wsl.ch/en/forest/forest-development-and-monitoring/long-term-forest-ecosystem-research-lwf/sites/chironico.html22 years ago
- This dataset contains all data on which the following publication below is based. Paper Citation: Risch Anita C., Zimmermann, Stefan, Schütz, Martin, Borer, Elizabeth T., Broadbent, Arthur A.D., Caldeira, Maria C., Davies, Kendi F., Eisenhauer, Nico, Eskelinen, Anu, Fay, Philip A., Hagedorn, Frank, Knops, Johannes M.H., Lembrechts, Jonas, J., MacDougall, Andrew S., McCulley, Rebecca L., Melbourne, Brett A., Moore, Joslin L., Power, Sally A., Seabloom, Eric W., Silveira, Maria L., Virtanen, Risto, Yahdjian, Laura, Ochoa-Hueso, Raul (accepted). Drivers of the microbial metabolic quotient across global grasslands. Global Ecology and Biogeography Please cite this paper together with the citation for the datafile. The microbial metabolic quotient (MMQ; mg CO2-C mg MBC-1 h-1), defined as the amount of microbial CO2 respired (MR; mg CO2-C kg soil-1 h-1) per unit of microbial biomass C (MBC; mg C kg soil-1), is a key parameter for understanding the microbial regulation of the carbon (C) cycle, including soil C sequestration. Here, we experimentally tested hypotheses about the individual and interactive effects of multiple nutrient addition (NPK+micronutrients) and herbivore exclusion on MR, MBC, and MMQ across 23 sites (5 continents). Our sites encompassed a wide range of edaphoclimatic conditions, thus we assessed which edaphoclimatic variables affected MMQ the most and how they interacted with our treatments. Soils were collected in plots with established experimental treatments. MR was assessed in a five-week laboratory incubation without glucose addition, MBC via substrate-induced respiration. MMQ was calculated as MR/MBC and corrected for soil temperatures (MMQsoil). Using LMMs and SEMs, we analysed how edaphoclimatic characteristics and treatments interactively affected MMQsoil. MMQsoil was higher in locations with higher mean annual temperature, lower water holding capacity, and soil organic C concentration, but did not respond to our treatments across sites as neither MR nor MBC changed. We attributed this relative homeostasis to our treatments to the modulating influence of edaphoclimatic variables. For example, herbivore exclusion, regardless of fertilization, led to greater MMQsoil only at sites with lower soil organic C (<1.7%). Our results pinpoint the main variables related to MMQsoil across grasslands and emphasize the importance of the local edaphoclimatic conditions in controlling the response of the C cycle to anthropogenic stressors. By testing hypotheses about MMQsoil across global edaphoclimatic gradients, this work also helps to align the conflicting results of prior studies.12 years ago
- Forest owners of the Canton of Lucerne were survey about their willingness to employ different forest management measures to provicde climate regulation services by forests. Of the nearly 3000 forest owners that received an invitation to a online-survey and the 900 forest owners that received a paper and pencil survey, 1055 valid responses were received. The questionnaire contained a survey experiment in which 9 choice situations were presented to the respondents in which they had the choice between two options and the status quo. This survey experiment part of the survey was completed by 990 respondents.22 years ago
- In order to use the QGIS plugin ‘Seilaplan’ for digital cable line planning, a digital terrain model (DTM) is required. The plugin ‘Swiss Geo Downloader’, which is available for the open source geoinformation software QGIS, allows freely available Swiss geodata to be downloaded and displayed directly within QGIS. It was developed in 2021 by Patricia Moll in collaboration with the Swiss Federal Institute for Forest, Snow and Landscape Research WSL. In this tutorial we describe how to download the high accuracy elevation model ‘swissALTI3D’ with the help of the ‘Swiss Geo Downloader’ and how to use it for digital planning of a cable line with the plugin ‘Seilaplan’. Please note that the tutorial language is German! Link to the Swiss Geo Downloader: https://pimoll.github.io/swissgeodownloader Link to Seilaplan website: https://seilaplan.wsl.ch ********************* Für die Verwendung des QGIS Plugins Seilaplan zur digitalen Seillinienplanung ist ein digitales Höhenmodell (DHM) nötig. Das Plugin Swiss Geo Downloader, welches für das Open Source Geoinformationssystem QGIS zur Verfügung steht, ermöglicht frei verfügbare Schweizer Geodaten direkt innerhalb von QGIS herunterzuladen und anzuzeigen. Es wurde 2021 von Patricia Moll in Zusammenarbeit mit der eidgenössischen Forschungsanstalt Wald, Schnee und Landschaft WSL entwickelt. In diesem Tutorial beschreiben wir, wie man mit Hilfe des Swiss Geo Downloaders das hochgenaue Höhenmodell swissALTI3D herunterladen und für die Seillinienplanung mit dem Plugin Seilaplan verwenden kann. Link zum Swiss Geo Downloader: https://pimoll.github.io/swissgeodownloader Link zur Seilaplan-Webseite: https://seilaplan.wsl.ch22 years ago
- This dataset contains the data used and collected to investigate the reliability of avalanche size estimates and avalanche outlines (see related publications). Namely this is #### Avalanche size estimates #### * the 10 pictures depicting avalanches * the survey results from the 170 participants #### Avalanche outlines mapped from oblique photographs #### * the pictures of the six avalanches * the avalanche outlines mapped by the 10 participants * the reference mapped from the georeferenced photographs #### Avalanche outlines from remotely-sensed imagery #### * the orthophotos in the four different resolutions (2m, 1m, 50cm, 25cm) * the area of interest (AoI) delimiting the research area * the avalanche mappings in each resolution for all five participants * the shade masks used to separate illuminated and shaded areas The acquisition of the orthophotos has been partially supported by the Swiss National Science Foundation (SNF; Grant N°200021_172800).12 years ago
- # Background information The Stillberg ecological treeline research site is located in the transition zone between the relatively humid climate of the Northern Alps and the continental climate of the Central Alps. In 1975, 92,000 seedlings of the high-elevation conifer species *Larix decidua* Mill. (European larch), *Pinus cembra* L. (Cembran pine), and *Pinus mugo* ssp. *uncinata* (DC.) Domin (mountain pine) were systematically planted across an area of 5 hectares along an elevation gradient of about 150 metres, with the aim to develop ecologically, technically, and economically sustainable afforestation techniques at the treeline to reduce the risk of snow avalanches. In the course of time, additional research aspects gained importance, such as the ecology of the treeline ecotone under global change. Alongside the ecological long-term monitoring of the afforestation, several meteorological stations have recorded local meteorological conditions at the Stillberg research site. Here, we provide the Davos Stillberg meteorological timeseries of five stations from 1975 (01-01-1975), the year of the afforestation establishment, until the end of the year 2022 (31-12-2022). # Station description The five meteorological stations were all installed at the same location (46°46′25.015″N 9°52′01.792″E) at 2090 m a.s.l., in the lower part of the afforestation area. In general, the five stations were operated sequentially (Stillberg_meteo_metadata_stations_v1.csv). However, there are some overlapping time periods when more than one station was operated in parallel. The stations have recorded environmental parameters, such as air and soil temperature, dew point temperature, air pressure, relative humidity, wind direction and velocity, radiation, precipitation, and snow depth (Stillberg_meteo_metadata_parameters_v1.csv). The meteorological measurements were recorded hourly from 1975 until 1996 and have been recorded in 10-minute intervals since 1997. # Data description We processed the Davos Stillberg meteorological timeseries with the MeteoIO meteorological data pre-processing library (Bavay & Egger, 2014). Data files are provided for each station and quality level separately and named according to the station (see ‘Stillberg_meteo_metadata_stations_v1.csv’). From the raw data in their original formats, we generated three data quality levels: raw standardized (folder ‘raw_standardized’), edited (folder ‘raw_edited’) and filtered (folder ‘filtered’). The processing level is indicated in the headers of the data files. The whole processing protocol is described in a set of human-readable configuration files that are used by MeteoIO to generate the required data quality levels. This improves long-term reproducibility (Bavay et al., 2022), as the data could be regenerated in the future, even using a completely different software, to account for additional data points or to introduce new data corrections. The first quality level (raw standardized) is generated by parsing the original data files and interpreting them in order to convert all data points to a common format and meteorological parameter naming scheme, while excluding unreadable or duplicated data lines. The generated data files are derivatives of CSV files, with a standardised header that contains the metadata that are necessary to interpret and use the data (use metadata) and to populate a data index (search metadata). The latter is a textual implementation of the Attribute Convention for Data Discovery (ACDD) metadata standard (Attribute Convention for Data Discovery 1-3, 2022). The second quality level (edited) builds on the raw data by performing low-level data editing, such as removing some data periods that are known to be unusable (often based on maintenance records or anecdotal evidence) or applying undocumented calibration factors (for example, when there seems to be an obvious offset on a measured parameter for a period between two documented maintenance operations). The third quality level is generated by applying statistical filters on the data (per station and per meteorological parameter) to exclude presumably wrong values. We did not perform gap filling, as no single strategy could be relied upon that would work best for all possible data usage scenarios.32 years ago
- Two data sets obtained for snow farming projects (Fluela, Davos, CH and Martell, IT) in 2015. The data set contains for each site: * 10 cm GIS raster of snow depth calculated from terrestrial laserscanning surveys (TLS) in the end of winter season (April/May) * 10 cm GIS raster of snow depth calculated from TLS in the end of summer season (October) Input files for SNOWPACK model: * .sno: snow profile at the end of winter * .smet: meteorological data measured by weather stations in the area For more details see Grünewald, T., Lehning, M., and Wolfsperger, F.: Snow farming: Conserving snow over the summer season, The Cryosphere Discuss., https://doi.org/10.5194/tc-2017-93, in review, 2017.82 years ago
- Ontologies used for the case study in the publication. Creative Commons (CC) license: CC BY-NC-SA12 years ago
- 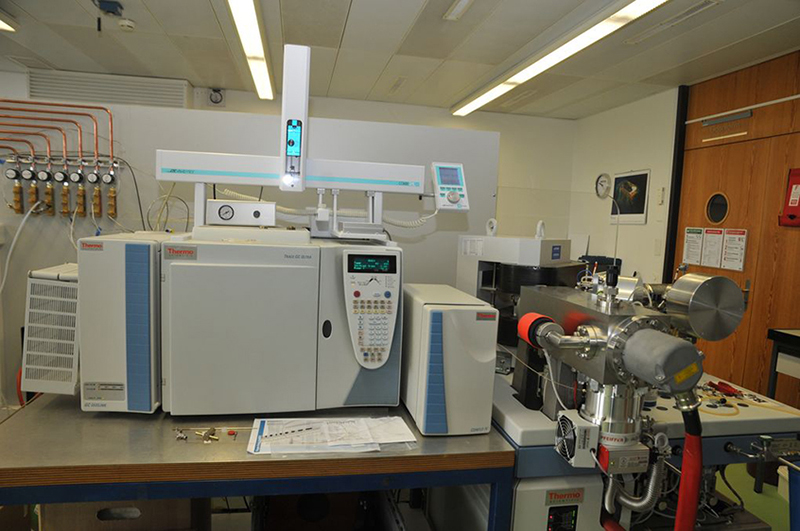 The lab uses stable isotope ratios of the light elements hydrogen, carbon, nitrogen and oxygen as a universal tool for studying physical, chemical and biological processes in forests and other ecosystems. Due to natural isotope fractionations, environmental changes leave unique fingerprints in organic matter, like tree-rings. It is, therefore, possible to detect the influence of ongoing climate changes on plant physiology. By applying isotopically labelled substrate, matter fluxes through plants and soil can be traced and better understood. The facility has isotope-Ratio mass-spectrometers and dedicated periphery for the analysis of organic matter, gas samples and water samples. With HPLC and GC we apply compound-specific isotope ratio analysis of sugars and organic acids. Additional isotope mass-spectrometers are operated by the Zentrallabor WSL.12 years ago
- This dataset includes gridded data on snow depth (m), snow water equivalent (mm), runoff from snow melt (mm) and snow cover fraction for Swtzerland. The data is spanning the water years 2016-2022 at a high spatial resolution of 250 m. Data are stored as daily results.12 years ago
- In an expanding bark beetle (Ips typographus) infestation spot emergence traps were installed on the stems of newly infested spruce trees capturing all emerging insects during several consecutive years. Two locations were sampled on elavations with univoltine and bivoltine generations, respectively. Bark beetles and their insect predators and parasitoids were identified to species level by specialists.12 years ago
- Scanning wind Lidar from Meteoswiss was installed at Davos Wolfgang (LON: 9.853594, LAT: 46.835577) and measured from 200 m above ground to 8100 m. The time resolution is up to 5 seconds. The Lidar was measuring wind profiles but also performed plan position indicator (PPI) and range height indicator (RHI) scans.12 years ago
- Data from a 17-year-long irrigation experiment (Pfynwald, Switzerland) in a naturally dry forest dominated by 100-year-old pine trees (Pinus sylvestris). Data include: (1) properties of soils sampled in 2011 and 2019 (SOC and N concentrations and stocks, soil masses, 13C and 15N natural abundances, C/N ratios, clay content, pH, inorganic C, stoniness, bulk density); (2) litter mass loss and initial litter chemistry of dominant tree species (Quercus, Pinus, Viburnum) from a litter decomposition experiment carried out in 2014-2015; (3) soil fauna abundance sampled in 2015; (4) soil volumetric water content and soil temperature at 10 cm depth measured during the litter decomposition experiment in 2014-2015; (5) soil mesofauna (Acari and Collembola) diversity and community composition from sampling in 2017; (6) irrigation-induced changes in litterfall (2013-2014, 2016-2017), fine-root production (data 2015 from Brunner et al., 2019, Frontiers in Plant Science), annual soil respiration (estimated for 2014-2015), litter mass loss from litter decomposition experiment (May-October 2014), and SOC stocks measured in 2011 and 2019; (7) Moisture dependency of microbial soil respiration (0-10 cm depth, adapted from Joseph et al., 2020 PNAS), soil respiration measured in 2015 and abundance of Acari, Collembola and Lumbricidae sampled in 2015.12 years ago
- Table of content: 1. Frequency of early concepts; 2. Frequency of additional concepts; 3. Use of any early concept; 4. Use of any additional concept, 5. Planning steps; 6. Protocol. The present dataset is part of the published scientific paper entitled “Landscape ecological concepts in planning: review of recent developments” (Hersperger et al., 2021). The goal of this research was to review recent publications to assess the use of landscape ecological concepts in planning. Specifically, we address the following research questions: Q1. Landscape ecological concepts: What are they? How frequently are they mentioned in current research? Q2. How are landscape ecological concepts integrated in landscape planning? We analysed all empirical and overview papers that have been published in four key academic journals in the field of landscape ecology and landscape planning in the years 2015–2019 (n = 1918). Four key journals in the field of landscape ecology were selected to conduct the analysis, respectively Landscape Ecology (LE), Landscape Online (LO), Current Landscape Ecology Reports (CLER), and Landscape and Urban Planning (LUP). The title, abstract and keywords of all papers were read in order to identify landscape ecological concepts. Then, all 1918 papers went through a keyword search to identify the use of early and additional concepts. We used the “pdfsearch” package in R programming language and searched for singular and plural forms and different variations of the concepts (see Supplementary material 1, Table A). As a result, we provided four outputs: 1. Frequency of early concepts. This data provides the total number of times each article used each early concept (Q1). This data was used to produce the Figure 2a at the original publication. 2. Frequency of additional concepts. This data provides the total number of times each article used each additional concept (Q1). This data was used to produce the Figure 2b at the original publication. 3. Use of any early concept. This data provides the total number of times each article used any early concept (Q1). This data was used to produce the Figure 3a at the original publication. 4. Use of any additional concept. This data provides the total number of times each article used any additional concept (Q1). This data was used to produce the Figure 3b at the original publication. To address the second question (Q2), the title, abstract and keywords of the papers included in our sample (n=1918 articles) were screened to identify papers that might show how landscape ecological concepts are integrated into planning. We selected 52 empirical papers (see Supplementary material – 4 Integration of landscape ecological concepts into planning), and we provided two outputs: 5. Planning steps. This data provides the number of times landscape ecological concepts were addressed in each planning steps in 52 empirical papers analysed in detail (Q2). This data was used to produce the Figure 4 at the original publication. 6. Protocol for assessing the integration of landscape ecological concepts into planning. To systematically collect the data, we used this protocol which addressed the following questions: (a) which type of planning is addressed by the paper? (b) to which planning level does the paper refer to? (c) which concepts are integrated in any of the planning steps described above?62 years ago
- An R Computing Software package which provides a flexible and easy-to-use interface for the Physiological Processes Predicting Growth (3-PG) model written in Fortran. The r3PG, a new Fortran implementation of 3-PG, serves as a flexible and easy-to-use interface for the 3-PGpjs (monospecific, evenaged and evergreen forests) described in Landsberg & Waring (1997) and the 3-PGmix (deciduous, uneven-aged or mixed-species forests) described in Forrester & Tang (2016) .32 years ago
- The dataset provides simulated 1) precipitation, 2) discharge, 3) soil moisture, and 4) low-flow simulations for 307 medium-sized catchments in Switzerland for the period 1981-2018. The data were simulated using the hydrological model PREVAH in its gridded-version. The simulated time series are provided at daily resolution. A detailed description of the modeling approach can be found in Brunner et al. 2019 submitted to NHESS.52 years ago
- The SLF avalanche warning service operates an extensive network of manual measuring sites. The sites are distributed throughout the Swiss Alps and predominantly situated in intermediate altitude zones, between 1000 and 2000 m. Some of the measurement series already span very long periods and are therefore highly valued; the data are also used for climatological and hydrological purposes. The measuring sites are in fixed locations, which are flat and wind-protected. The observers who perform the measurements are trained and paid by the SLF. Data is collected, as far as possible, from the beginning of November until the end of April and after that until half of the measuring site is snow-free. On some measuring sites event-based measurements are also collected during the summer months. If possible, measurements take place between 7 and 7.30 am local time. The following variables are measured at all measuring sites: - snow depth and 24-hour new snow at numerous sites this additional variable is measured: - water equivalent of 24-hour new snow (height of the water column in millimeters, if the new snow sample is melted, without changing the base area) __When using the data, please consider and adhere to the associated [Terms of Use](https://www.slf.ch/en/services-and-products/data-and-monitoring/slf-data-service.html)__. __To download live data use our [API](https://measurement-api.slf.ch)__. __To download data older than 7 days use our [File Download](https://measurement-data.slf.ch)__.32 years ago
- In the context of landslide early warning research, soil moisture (e.g. volumetric soil water content and soil water potential) has been measured at six locations in the Napf-region (Emmental, central Switzerland) since April 2019. Here, we provide the hourly mean values of all sensors from all 6 locations after a comprehensive data control, filtering and aggregation (from 10-min to 1-hour values). A sub-set of these data (for the locations Wasen i.E.) has previously been published in envidat.ch at https://www.doi.org/10.16904/envidat.369 applying the same data post-processing method. The dataset is complemented with meteorological data (locally measured air temperature and precipitation) as well as soil temperature. A detailed description of the sites and measurement installations can be found in a separate report (attached with the data).72 years ago
- Animal biodiversity in cities is generally expected to be uniformly reduced, but recent studies show that this is modulated by the composition and configuration of Urban Green Areas (UGAs). UGAs represent a heterogeneous network of vegetated spaces in urban settings that have repeatedly shown to support a significant part of native diurnal animal biodiversity. However, nocturnal taxa have so far been understudied, constraining our understanding of the role of UGAs on maintaining ecological connectivity and enhancing overall biodiversity. We present a well-replicated multi-city study on the factors driving bat and nocturnal insect biodiversity in three European cities. To achieve this, we sampled bats with ultrasound recorders and flying insects with light traps during the summer of 2018. Results showed a greater abundance and diversity of bats and nocturnal insects in the city of Zurich, followed by Antwerp and Paris. We identified artificial lighting in the UGA to lower bat diversity by probably filtering out light-sensitive species. We also found a negative correlation between both bat activity and diversity and insect abundance, suggesting a top-down control. An in-depth analysis of the Zurich data revealed divergent responses of the nocturnal fauna to landscape variables, while pointing out a bottom-up control of insect diversity on bats. Thus, to effectively preserve biodiversity in urban environments, UGAs management decisions should take into account the combined ecological needs of bats and nocturnal insects and consider the specific spatial topology of UGAs in each city.42 years ago
- The present dataset is part of the report titled Gradinaru S.R., Hersperger A.M., Schmid F. (2021). Deriving Planning Intentions from written planning documents. Report on CONCUR Project- From plans to land change: how strategic spatial planning contributes to the development of urban regions. The data corresponds to the data collected as part of the DPI Method for deriving all PIs contained in a plan (open coding) as detailed in section 4 of the report. The method involved reading the plans to break down of information in meaningful discrete “incidents” or planning intentions. To identify the planning intentions, the starting points were represented by a) the structuring of the plans in chapters and sub chapters and b) the themes that the plans addressed. Thus, the collected information was not grouped according to pre-defined categories of planning intentions, but rather put together as a list of intentions as revealed by each plan. As a result, we provide, for each case study, a document (named [Urban region name] PI as defined in the plan) which contains: Date when the information was filled in. Name of the urban region and analysed strategic spatial plan . A list of all planning intentions contained in a plan, with each PI being addresses as follows: Name of PI as it appears in the plan Translated name of the PI (i.e. short name for easy understanding of the meaning) Explanation regarding the meaning of the PI Why the PI is considered a priority for the urban region Spatial information on the PI (text and cartographic representations). In total, 14 documents are available, one for each case study. Documents contain up to 20 pages of information extracted from the plans together with explanations and notes taken during plan reading.12 years ago
- # Background information Climate change-induced range expansion of treeline populations depends on their successful recruitment, which requires dispersal of viable seeds followed by successful establishment of individual propagules. The Global Treeline Range Expansion Experiment (G-TREE) is a global initiative involving researchers from Europe, North America, Australia and New Zealand (Brown et al., 2013). At 15 alpine and Arctic treeline sites worldwide the mechanisms determining the elevational and latitudinal distribution of tree populations are studied using a standardized experimental approach. In summer 2013, a multifactorial seedling recruitment experiment has been established at the Stillberg ecological treeline research site. The aim of this experiment, is to quantify the effect of multiple abiotic and biotic drivers on emergence, survival, and growth of *Larix decidua* and *Picea abies* seedlings in replicated plots along an elevation gradient with three sites below (1930 m a.s.l.), at (2090 m a.s.l.), and above treeline (2410 m a.s.l.; Frei et al., 2018). All plots have been surveyed annually to count seedlings and to measure their total height. Additional environmental factors, such as soil temperature, have been recorded. # Experimental design The Stillberg research area is located in the Eastern Swiss Alps near Davos, Switzerland. The site has been used for several long-term monitoring as well as experimental studies for the last four decades. Our G-TREE experiment consists of a lowest site located in a subalpine Larch-Spruce forest (*Larici-Picetum*) dominated by *Larix decidua* and *Picea abies* (1930 m a.s.l.), a transition zone site dominated by alpine shrubs (2100 m a.s.l.), and an uppermost site in an alpine meadow with some dwarf shrubs (2390 m a.s.l.). The three experimental sites were set up following the standard protocol of the global G-TREE initiative (Brown et al., 2013). In a split-plot design, 20 plots (224 cm × 45 cm) were established at each site, which were randomly assigned to the 2 × 2 treatment combinations of the main factors seeding and scarification (i.e. seeding and scarification, seeding only, scarification only, and full control), resulting in five replications per main treatment combination. Each plot was divided into 16 split-plots (22.5 cm × 28 cm), to which treatment combinations of four additional two-level factors species (larch and spruce), provenance (low- and high-elevation), herbivore exclosure (with and without exclosure), and seeding year (2013, 2014) were randomly assigned, which resulted in a total of 960 split-plots (Details see Frei et al. 2018). # Data description All plots have been surveyed annually to count seedlings and to measure their total height. Seedling height was assessed with a hand ruler as the total length from the original emerging point to the apical meristem (Details see Frei et al. 2018). Additionally, soil temperature at each site, has been continuously recorded since 2013. Here, we present data from eight years (2013–2021).22 years ago
- This repository contains data on EDA measurements of visitors with different cultural backgrounds in virtual urban park settings. The parks are a Persian garden (Shiraz, Iran) and a historical park in Zurich, Switzerland. The cultural background of the visitors is Persian and Central European. The repository contains raw data from EDA, processed time series and statistical procedures.62 years ago
- Although much of the endemic biodiversity of Madagascar can be attributed to its isolation as an island in the Indian Ocean, the high rates of speciation throughout its geologic history suggest an influence of local-scale landscape dynamics. The topographic evolution of Madagascar is dominated by the formation of high-relief continental rift escarpment and we argue that the erosion and landward retreat of this topography creates habitat heterogeneity that has served as a speciation pump for the island. The highest plant richness is found along the escarpment and is characterized by steady diversification rates over the last 45 Ma. Modeled landscape evolution by escarpment retreat demonstrates opportunities for allopatric speciation by transient habitat fragmentation through multiple mechanisms, including catchment expansion, isolation of highland remnants and formation of topographic and river barriers The segregation of floral phylogenetic turnover parallel to the escarpment is consistent with these mechanisms and indicates the importance of erosion-driven landscape dynamics on speciation.22 years ago
- Leaf area index (LAI), defined as the total one-sided foliage area per unit ground surface area, is one of the most important characteristics of plant canopy structure. Leaves are the active interface between the atmosphere and the ecosystem. Thus, LAI affects many ecosystem processes, including light and precipitation interception, evapotranspiration, CO2 fluxes and dry deposition. LAI was measured repeatedly in the period 1996-2013 at 18 LWF plots using 1) a LAI-2000 plant canopy analyser (Licor, Inc) and 2) hemispherical photographs of the canopy. Measurements were performed above the 16 vegetation quadrats in the 43 m x 43 m intensive monitoring subplot. In 1996-2003, LAI measurements were usually carried out on the same day as the vegetation surveys. It is also planned to characterise the potential light conditions (diffuse and direct) using the hemispherical photographs of the canopy. ### Purpose: ### 1) To estimate an important structural parameter of the forest stand, which is needed as an input variable in most ecosystem process models simulating carbon and water cycles on a stand or regional scale; and 2) to document changes in the canopy structure, and thus in light conditions, which may be responsible for changes in ground vegetation ### Manual Citation: ### * Thimonier, A., 1997. Kapitel C6. Blattflächenindex (LAI), in: Brang, P. (Ed.), Aufnahmeanleitungen aller Forschungsprojekte auf Flächen der Langfristigen Waldökosystem-Forschung (LWF). Eidg. Forschungsanstalt WSL, Birmensdorf, pp. 1-5. * Thimonier, A., 1997. Kapitel C7. Lichtverhältnisse im Wald, in: Brang, P. (Ed.), Aufnahmeanleitungen aller Forschungsprojekte auf Flächen der Langfristigen Waldökosystem-Forschung (LWF). Eidg. Forschungsanstalt WSL, Birmensdorf, pp. 1-4. * Fleck S, Raspe S, Cater M, Schleppi P, Ukonmaanaho L, Greve M, Hertel C, Weis W, Rumpf, S., Thimonier, A., Chianucci, F., Beckschäfer, P., 2016: Part XVII: Leaf Area Measurements. In: UNECE ICP Forests Programme Co-ordinating Centre (ed.): Manual on methods and criteria for harmonized sampling, assessment, monitoring and analysis of the effects of air pollution on forests. Thünen Institute of Forest Ecosystems, Eberswalde, Germany, 34 p. + Annex [http://icp-forests.net/page/icp-forests-manual](http://icp-forests.net/page/icp-forests-manual) ### Paper Citation: ### * Thimonier A, Kull P, Keller W, Moser B, Wohlgemuth T (2011) Ground vegetation monitoring in Swiss forests: comparison of survey methods and implications for trend assessments. Environmental Monitoring and Assessment, 174: 47-63. [doi: 10.1007/s10661-010-1759-y](https://doi.org/10.1007/s10661-010-1759-y) * Thimonier A, Sedivy I, Schleppi P (2010) Estimating leaf area index in different types of mature forest stands in Switzerland: a comparison of methods. European Journal of Forest Research, 129 (4): 543-562. [10.1007/s10342-009-0353-8](https://doi.org/10.1007/s10342-009-0353-8)12 years ago
- Resources associated with the manuscript *A case study on the application of spore sampling for the monitoring of fungi* (Schlegel et al. 2023, submitted). Airborne environmental DNA (eDNA) monitoring of fungi was evaluated on a species-rich grassland site. Extensive fruiting body surveys yielded 29 waxcap and clavarioid species, 19 of which were also detectable in air eDNA. The analysis indicates that spores of locally occurring fruiting bodies were detected, in addition to a large diversity of common fungal species, while rare and threatened species were underrepresented in the air. The contents of the dataset (ZIP archive): * All analysis scripts in [R-Markdown](https://rmarkdown.rstudio.com) format, including the rendered PDF output with figures and tables (*analysis* directory) * eDNA sample metadata (*amplicon_meta*) and results of the amplicon clustering (*amplicon_data*) and the source code of the pipeline (*amplicon_pipeline*) * positions of all fruiting body groups found in the surveys (3838 GPS points) (*surveys*) * positions of the spore traps, taxonomy of studied grassland fungi and red-list species, and many more resources Please refer to `README.pdf` inside the archive for a complete description of the file structure and information on how to reproduce the analyses.12 years ago
- Dry weight (mass) of the belowground part (roots) of living trees and shrubs starting at 12 cm dbh. The dimensions of the roots are determined according to Zell and Wutzler. __Citation:__ > _Abegg, M.; Brändli, U.-B.; Cioldi, F.; Fischer, C.; Herold-Bonardi, A.; Huber M.; Keller, M.; Meile, R.; Rösler, E.; Speich, S.; Traub, B.; Vidondo, B. (2014). Fourth national forest inventory - result tables and maps on the Internet for the NFI 2009-2013 (NFI4b). [Published online 06.11.2014] Available from World Wide Web http://www.lfi.ch/resultate/ Birmensdorf, Swiss Federal Research Institute WSL. [doi:10.21258/1057112](https://doi.org/10.21258/1057112)_22 years ago
- Meteorological data used to run SNOWPACK for 58 catchments in the Swiss Alps. The data consists of a 2 km grid of "virtual meteorological stations" for each catchment. It was used to simulate snow cover processes during rain-on-snow events, therefore meteorological data of each catchment contains at least one rain-on-snow event. Further information can be found in the attached readme.txt and in Würzer & Jonas et al. (2017), currently under review in Hydrological Processes.22 years ago
- Continuous measurement of soil matrix potential at 15, 50 and 100 cm depth with Decagon MPS-2 sensors 1 m N, SE and SW from the stem of 3 threes within much and 3 trees within few shrubs ### Purpose: ### Explore the effect of shrubs on the water availability for pine trees in Visp.12 years ago
- # Dataset of an experimental campaign of induced rockfall in Tschamut, Grisons, Switzerland. The data archive contains site specific geographical data such as DEM and orthophoto as well as the deposition points of manually induced rockfall by releasing differently shaped boulders with 30–80 kg of mass. Additionally available are all the StoneNode data streams for rocks equipped with a sensor. The data set consists of * Deposition points from two series (wet (27/10/2016) and frozen (08/12/2016) ground) * Digital Elevation Model (grid resolution 2 m) obtained via UAV * Orthophoto (5 cm resolution) obtained via UAV * Digitized rock point clouds (.pts input files for RAMMS::ROCKFALL) * StoneNode v1.0 raw data stream for equipped rocks. Further information is found in * __A. Caviezel__ et al., _Design and Evaluation of a Low-Power Sensor Device for Induced Rockfall Experiments_, IEEE Transactions on Instrumentation and Measurement, 2018, 67, 767-779, http://ieeexplore.ieee.org/document/8122020/ * __ P. Niklaus__ et al., _StoneNode: A low-power sensor device for induced rockfall experiments_, 2017 IEEE Sensors Applications Symposium (SAS), 2017, 1-6, http://ieeexplore.ieee.org/document/7894081/22 years ago
- We used five different atmospheric turbulence datasets from four test sites, with these sites showing differences in their topographical characteristics. We chose one typical alpine test site with high topographical complexity (Weissfluhjoch, Davos, Switzerland) and three test sites consisting of one glacier site (Plaine Morte, Crans-Montana, Switzerland) and two polar sites (Greenland and Antarctica) representing a quasi-ideal site with homogeneous surface and quasi infinite fetch in all directions. The turbulent sensible heat flux was calculated using the eddy-covariance method. Note that the sonic temperature fluctuations have been converted into virtual temperature fluctuations. Three-dimensional wind velocity and air temperature were processed using a linear detrending (Rannik and Vesala, 1999) and a planar fit approach (Massmann and Lee, 2002) to rotate the coordinate system. Air temperature, relative humidity and air pressure from weather stations were used to calculate air properties, which are required for the data processing. The weather stations are located in the immediate vicinity of the turbulence tower and are affected by the same air masses. Turbulence data were averaged to 30-min intervals, whilst changing to a 15-min time interval marginally affects the heat fluxes at the Weissfluhjoch test site (Mott et al., 2011). Note that we define a negative sensible heat flux as being directed towards the snow surface and a positive sensible heat flux as being directed upwards. The selected datasets and corresponding test sites are briefly introduced below: Weissfluhjoch 2007 (WFJ07): A vertical set-up of two three-dimensional ultrasonic anemometers (CSAT3, Campbell Scientific, Inc.) was used at the traditional field site Weissfluhjoch (2540 m asl.) to measure three-dimensional wind velocity and air temperature at a frequency of 20 Hz. The sensors were mounted 3 m and 5 m above the ground and provided reliable data for 50 days between 11 February 2007 and 24 April 2007. Further information on the field campaign can be found in Stössel et al. (2010) and Mott et al. (2011). Weissfluhjoch 2011-13 (WFJ11): Three-dimensional wind velocity and air temperature were recorded at 5 m above the ground at a frequency of 10 Hz with a three-dimensional ultrasonic anemometer (CSAT3). The analysis was conducted for data obtained between February and March in the years 2011-13. Plaine Morte 2007 (PM07): Two three-dimensional ultrasonic anemometers (CSAT3) were installed on a horizontal boom facing opposite directions (west-north-west vs. east-south-east) at 3.75 m above the ground to measure air temperature and three-dimensional wind velocity at 20 Hz. The data were collected at the almost flat field site on the Plaine Morte glacier (2750 m asl.) near Crans-Montana, Switzerland from February to April 2007. High quality meteorological data were additionally recorded and used to force the model. A detailed description about the set-up at the Plaine Morte glacier can be found in Huwald et al. (2009) and Bou-Zeid et al. (2010). Greenland 2000 (GR00): High-frequency three-dimensional ultrasonic anemometer measurements (CSAT3) were recorded at 50 Hz at the Summit Camp (72.3 °N, 38.8 °W, 3208 m asl.) located on the northern dome of the Greenland ice sheet. Data were collected at 1 m and 2 m above the snow surface during summer in 2000 and 2001. Additionally, meteorological measurements were obtained for the post processing and used to force the model. More information about the field campaign can be found in Cullen et al. (2007, 2014). Antarctica 2000 (AA00): A set-up of three vertical three-dimensional ultrasonic anemometers (DA-600, Kaijo Denki) were installed at Mizuho Station (70°42' S, 44°20' E, 2230 m asl.) in Eastern Antarctica at 0.2, 1 and 25 m and recorded turbulence data at a frequency of 100 Hz from October to November 2000. Longwave and shortwave radiation, relative humidity, air and snow surface temperature were additionally measured and used to force the model. More information about the field campaign can be found in Nishimura and Nemoto (2005).102 years ago
- Understanding the interplay of local and landscape-scale drivers of plant-pollinator interactions is crucial to maintaining pollination services in urban environments. The data contains plant-pollinator interactions changed across two independent gradients of local flowering plant species richness and landscape-scale urbanisation level (proportional area of impervious surface within a 500-m radius) in 24 home gardens in the city of Zurich, Switzerland. The data also contains the trait values (tongue length, body size and activity time) of all visiting wild- and honeybees.12 years ago
- Increment including ingrowth minus the mortality. The correction for bias with the sample Tarif trees may be so drastic that it results in negative values with small numbers of trees. __Citation:__ > _Abegg, M.; Brändli, U.-B.; Cioldi, F.; Fischer, C.; Herold-Bonardi, A.; Huber M.; Keller, M.; Meile, R.; Rösler, E.; Speich, S.; Traub, B.; Vidondo, B. (2014). Fourth national forest inventory - result tables and maps on the Internet for the NFI 2009-2013 (NFI4b). [Published online 06.11.2014] Available from World Wide Web http://www.lfi.ch/resultate/ Birmensdorf, Swiss Federal Research Institute WSL. [doi:10.21258/1057112](https://doi.org/10.21258/1057112)_22 years ago
- We modelled the global distribution of 730 amphibian, 1276 reptile, and 1961 mammal species globally as a function of current climate at a 0.5° spatial resolution using four different predictor groups composed of different combinations of input variables: mean climatic conditions, spatial climatic variability, and temporal (interannual) climatic variability.82 years ago
- Swiss National Forest Inventory. Results of the fourth survey 2009–2017. The collection of data for the fourth National Forest Inventory (NFI) was carried out from 2009 to 2017, on average eight years after the third survey. The findings about state and development of Swiss forests are described and explained in detail. The report is structured according to the European criteria and indicators for sustainable forest management, namely: forest resources, health and vitality, wood production, biological diversity, protection forest and social economy. Finally, conclusions about sustainability are drawn based on the NFI findings. Keywords: forest area, growing stock, increment, yield, forest structure, forest condition, timber production, biodiversity, protection forest, recreation, sustainability, results National Forest Inventory, Switzerland Inventaire forestier national suisse. Résultats du quatrième inventaire 2009-2017. Les relevés du quatrième inventaire forestier national suisse (IFN) ont eu lieu entre 2009 et 2017, en moyenne huit ans après le troisième inventaire. Les résultats sur l’état et l’évolution de la forêt suisse sont présentés et expliqués en détail. Le rapport est structuré thématiquement selon les critères et indicateurs européens pour la gestion durable des forêts : ressources forestières, santé et vitalité, production de bois, diversité biologique, forêt protectrice et socio-économie. L’ouvrage s’achève par un bilan de la durabilité basé sur les résultats de l’IFN. Mots-clés : surface forestière, volume de bois, accroissement, exploitation, structure de la forêt, état de la forêt, production de bois, biodiversité, forêt protectrice, récréation, durabilité, résultats de l’inventaire forestier national, Suisse Content license: All rights reserved. Copyright © 2020 by WSL, Birmensdorf.32 years ago
- This data set was used to test whether species specialized to high elevations or with narrow elevational ranges show more conservative (i.e. less variable) trait responses across their elevational distribution, or in response to neighbours, than species from lower elevations or with wider elevational ranges. We did so by studying intraspecific trait variation of 66 species along 40 elevational gradients in four countries (Switzerland, Australia, New Zealand, China) in both hemispheres. As an indication of potential neighbour interactions that could drive trait variation, we also analysed plant species’ height ratio, its height relative to its nearest neighbour. The following traits and parameters were measured and are available in this data set: As an indication of plant stature, we measured vegetative and generative height, where vegetative height was distance from soil to highest vegetative leaf and generative height was distance to the highest point on the reproductive shoot. As a measure of reproductive investment, we noted the presence of flowers on the randomly chosen individuals (see below). As a measure of individual and genet basal area, we measured individual plant and patch diameters, in two dimensions (along the largest diameter and perpendicular to it). In clonal plant species, plant diameter was equivalent to an individual rosette, whereas patch diameter referred to the whole genet and could represent the size of a tuft, tussock or cushion. For genera with more singular growth forms (e.g., some Gentiana species) plant and patch diameter were the same. The two diameter measurements were made at right angles, allowing estimates of patch and plant areas to be calculated as an ellipse (i.e., area = 0.5 a 0.5 b Π). All traits were measured on ten randomly selected individuals per site. Flower count data was considered in a binary fashion on a per individual basis (because for some species individuals only produce one flower when flowering) so that the presence or absence of flower(s) was a nominal value between 0 and 10 for each species at each site. We then collected at least three leaves (up to 30 for small and light leaves) from each of the first three individuals selected from each species for determination of leaf dry matter content (LDMC) and specific leaf area (SLA). For calculations of LDMC and SLA, fresh leaves were scanned on a flatbed scanner to determine leaf area. Leaves were then weighed on a balance to a precision of +/- 0.001g, prior to being air dried and reweighed with a balance to a precision of +/- 0.0001g. LDMC was calculated by dividing dry leaf mass by fresh leaf mass. SLA was calculated by dividing leaf area by dry leaf mass. Additionally, within an area of 10 cm diameter around the target individual, we determined the tallest neighbouring species and measured its vegetative and generative height, and estimated the percent cover of the target species, other vegetation, rock, and bare soil. For more details see Rixen et al. 2022, Journal of Ecology.22 years ago
- This is an R script written to calculate the relative terrain aspect parameter, which is utilized in the preferential snowfall downscaling scheme for mountainous terrain. The code reads a terrain aspect angle grid from file 'terrain_aspect_grid.txt' and writes the computed relative terrain aspect angle grid to file 'delta_psi_grid.txt'.12 years ago
- Tree circumference, height, height to crown base measurements, mortality, decay class and removal assessment on LWF plots ### Purpose: ### Assessment of tree and forest growth ### Manual Citation: ### * Matthias Dobbertin, Christian Hug, 1999: Vorläufige Feld-Aufnahmeanleitung für die BHU- und Höhen-Inventur auf LWF-Flächen (V1.0), Langfristige Waldökosystem-Forschung, Eidg. Forschungsanstalt WSL, Birmensdorf, 18 S. * Christian Hug, Matthias Dobbertin, Chris Nussbaumer, Yves Stettler, 2010: Provisorische Aufnahmeanleitung für die Brusthöhenumfang- und Höheninventur auf LWF-Flächen. Langfristige Waldökosystem-Forschung, Eidg. Forschungsanstalt WSL, Birmensdorf, 29 S. * Christian Hug, Chris Nussbaumer, Yves Stettler, 2014: Aufnahmeanleitung für die Brusthöhenumfang und Höheninventur auf LWF-Flächen. Langfristige Waldökosystem-Forschung, Eidg. Forschungsanstalt WSL, Birmensdorf, 36 S. * Dobbertin M, Neumann M, 2016: Part V: Tree Growth. In: UNECE ICP Forests, Programme Co-ordinating Centre (ed.): Manual on methods and criteria for harmonized sampling, assessment, monitoring and analysis of the effects of air pollution on forests. Thünen Institute of Forest Ecosystems, Eberswalde, Germany, 17 p. + Annex [http://icp-forests.net/page/icp-forests-manual](http://icp-forests.net/page/icp-forests-manual) ### Paper Citation: ### * Etzold S, Waldner P, Thimonier A, Schmitt M, Dobbertin M (2014) Tree growth in Swiss forests between 1995 and 2010 in relation to climate and stand conditions: Recent disturbances matter. Forest Ecology and Management, 311: 41-55. [doi: 10.1016/j.foreco.2013.05.040](http://dx.doi.org/10.1016/j.foreco.2013.05.040)12 years ago
- Table of Content: 1. General context of the data set "LUSzoning”; 2. Background and aims of the study using the data set LUSzoning; 3. The data set LUSzoning. ###1. __General context of the data set "LUSzoning".__ The data set "LUSzoning" stands for Land-use simulations integrating zoning regulations in Spanish functional urban areas. The data set has been generated as part of the CONCUR research project (https://www.wsl.ch/en/projects/concur.html) led by Dr. Anna M. Hersperger and funded by the Swiss National Science Foundation (ERC TBS Consolidator Grant (ID: BSCGIO 157789) for the period 2016-2021. The CONCUR research project is interdisciplinary and aims to develop a scientific basis for adequately integrating spatial policies (in this case, digital zoning plans) into quantitative land-change modelling approaches at the urban regional level. ###2. __Background and aims of the study using the data set “LUSzoning”.__ As part of the CONCUR project, a specific task was to integrate planning spatial policies in land-change modelling. Planning can be implemented in modelling using either hard or gradual restrictions. Different studies have addressed the inclusion of spatial planning policies in land-use change modelling. However, the integration of zoning constraints is generally established as hard or Boolean-based restrictions (e.g., whether urban development is allowed or not), while not accounting for the spatial heterogeneity or gradual characteristics within planning zones (e.g., whether planning regulations allow low, medium or high urban density), though these could improve real patterns simulations in urban areas. We assume Spanish General Zoning plans were suitable to explore the integration of planning into land-change modelling as soft constrains because they define land-use intensities in the buildable zoning areas. In light of the above considerations, the overall aim of the study was to model urban land-use changes using a multi-scenario approach that integrates digitized zoning plans for the Functional Urban Areas (FUAs) of Madrid, Barcelona, Valencia, and Zaragoza. The following specific objectives were addressed: i) to analyse the role of planning by defining three future scenarios that integrate digitized zoning plans and one scenario that assumes almost no planning intervention; ii) to introduce zoning constraints that reflect different degrees of urban densities; iii) to generate a transferable spatially-explicit modelling framework to integrate planning into land-use change simulations. Four future land-use demands scenarios were defined for the FUAs. Storylines were created considering probable development scenarios related to zoning plans, current Spanish legislation and sustainability goals defined along two axes: a high market-oriented vs. high planning-intervention axis, and an axis of short-term economic growth vs. long-term sustainable growth. The sustainable development scenario (S1) is characterized by low gross floor area (GFA) growth that is limited to areas that are currently under development according to zoning plans. The business-as-usual scenario (S2) is characterized by medium GFA growth in the range of on-going trends. The strong development scenario (S3) is characterized by high GFA growth rates. Growth is restricted to buildable areas without urbanization project designated in zoning plans. The unrestricted development scenario (S4) prioritizes a high degree of market liberalization characterized by high GFA growth that surpasses population demands. S4 follows a rapid economic growth pattern with almost no planning intervention. ###3. __The data set “LUSzoning”.__ The dataset includes 16 .asc raster layers providing the simulated land-uses under four defined scenarios for Barcelona, Madrid, Valencia and Zaragoza Functional Urban Areas (FUAs) for 2030. The simulated raster layers were created using CLUMondo simulation framework and have a spatial resolution of 30m. The .asc layers name include the name of the FUA and scenario number. For example, the output from simulating the urban growth for the city of Zaragoza under Scenario 2 is named “Zaragoza_S2.tif”. Furthermore, a .txt file named “Legend.txt” includes the numeric value of the land-use and the category of land-use that represents to interpret the .asc raster layers. The name of the land-use classes is a reclassification of the Urban Atlas 2012 land-use classes within the four Spanish FUAs analyzed.172 years ago
- The present dataset is part of the published scientific paper Bacău, S., Grădinaru, S. R., & Hersperger, A. M. (2020). Spatial plans as relational data: Using social network analysis to assess consistency among Bucharest’s planning instruments. Land Use Policy, 92. The goal of this paper was to first develop a theoretical framework for external consistency assessment in spatial plans and then to test the framework with ten spatial plans of the Bucharest (Romania) region. Specifically, the paper has the following workflow: (i) to develop a framework for consistency assessment covering four categories of external consistency; (ii) to extract relevant plan statements from all plans on the four categories; (iii) to assign one-way, symmetrical and contradictory relationships between the extracted plan statements; and (iv) to assess consistencies, inconsistencies and contradictions between plans using directed and valued network analyses. All results were then validated by applying questionnaires to local experts. The study focuses on a sample consisting of 10 spatial plans of Bucharest that: (1) are currently in force, (2) have spatial implications, (3) involve different administrative levels and (4) come from different planning sectors. The list of the reviewed planning documents can be found in Table 2 of the paper. The framework of consistency assessment contains 24 items, which can be found in Table 1 of the paper. All planning documents were read in respect to all items of the framework in order to extract plan statements used in the analysis. As a result, we provide the plan statement extracted from 10 plans on the 24 items of the framework. All data is in Romanian. The data was discussed qualitatively in the research paper.12 years ago
- Each set includes the meteorological variables (resampled 24-hour averages) and the profile variables extracted from the simulated profiles for each of the weather stations of the IMIS network in Switzerland, and, the danger ratings for dry-snow conditions assigned to the location of the station. The data set of RF 1 contains the danger ratings published in the official Swiss avalanche bulletin, and the data set of RF 2 is a quality-controlled subset of danger ratings. These data are the basis of the following publication: Pérez-Guillén, C., Techel, F., Hendrick, M., Volpi, M., van Herwijnen, A., Olevski, T., Obozinski, G., Pérez-Cruz, F., and Schweizer, J.: Data-driven automated predictions of the avalanche danger level for dry-snow conditions in Switzerland, Nat. Hazards Earth Syst. Sci., 22, 2031–2056, https://doi.org/10.5194/nhess-22-2031-2022, 2022.32 years ago
- Measurement of tree ring widts in tree stem disks according to 'Bräker O.U. (1993) Anleitung zur Entnahme von Stammscheiben auf Ertragskundeflächen' ### Purpose: ### tree growth12 years ago
- This dataset contain measurements of solute and stable water isotopes in stream water and precipitation in the Alp catchment and two of its tributaries (between 2015 -2018) . The river Alp is a snow-dominated catchment situated in Central Switzerland characterized by an elevation range from 840 to 1898 m a.s.l. The dataset provides solutes (major anions and cations, trace metals) and stable water isotopes and water fluxes (precipitation rates, discharge) at daily intervals from several sampling locations. An updated version of the isotope dataset is available here: https://www.doi.org/10.16904/envidat.24222 years ago
- Title: Does zoning contain built-up land expansion? Causal evidence from Zhangzhou City, China. Research objective: Built-up land zoning is an imporatant policy measure of land use planning (LUP) to contain built-up land expansion in China. We used a difference-indifference model with propensity score matching to estimate the average and annual effect of built-up land zoning on built-up land expansion in Zhangzhou City, China between 2010 and 2020. Data: Data.dbf contains the varibles of 1662 villages in Zhangzhou Cities in 1995, 2000, 2005, 2010, 2013, 2015, 2018, and 2020. XZQDM2 is villages' unique administrative ID; Area is the land area of village i; Dis2water is the Euclidean distance from village i to the nearest waterbody; Dis2coastl is the Euclidean distance from village i to the nearest coastline; Dis2city is the the Euclidean distance from village i to the city center; Dis2county is the the Euclidean distance from village i to the nearest county center; Elevation is the the average elevation within village i; Dis2road is the the Euclidean distance from village i to the nearest road; Nei_Built_ is the the area of built-up land (Nei Built.upit) in the neighboring villages of village i in year t; Treated is a binary variable, Treated = 1 to the villages that were partially or entirely located inside the development-permitted zones, and Treated = 0 to the villages that were entirely located outside the development-permitted zones; Intensity is the percentage of land that was assigned to the development-permitted zones in village i; Year represent the year in 1995, 2000, 2005, 2010, 2013, 2015, 2018, and 2020; BuLE is the dependent variable, representing built-up land expansion in village i in year t; Town is town' unique administrative ID. Method: First, we employed propensity score matching to overcome the selection bias and satisfy the parallel trend assumption. Second, we built four Difference-in-Difference models to estimate the average and annual effect.12 years ago
- The files contain the data used in Flury et al. "Soil and climate-dependent ingrowth inference: broadleaves on their slow way to conquer Swiss forests" submitted to the scientific journal Ecography, 2023. The data stored here were derived from the Swiss NFI1-4 and the already available data of NFI5 until the end of 2022. The raw data from the Swiss NFI can be provided free of charge within the scope of a contractual agreement (http://www.lfi.ch/dienstleist/daten-en.php). The files 'Data Figure 2' to 'Data Figure 6' are publicly available and contain the data used to produce the figures from the manuscript "Soil and climate-dependent ingrowth inference: broadleaves on their slow way to conquer Swiss forests". The R code which enables the reproduction of these figures is available in 'R-source.zip'. The analysis of this data was done with the statistical software R (R version 4.2.2).62 years ago
- This report was prepared as one of the synthesis report chapters of the Hydro-CH2018 project of the Federal Office for the Environment (FOEN). In earlier reports such as the CH2014-IMPACTS report (CH-Impacts 2014), the topic of mountain permafrost hydrology was not addressed. Here, we provide a baseline of the available knowledge of mountain permafrost in the Swiss Alps for future reference. We compile an overview of the current understanding of mountain permafrost in the Swiss Alps, its distribution and characteristics, observed and projected changes, and expected impacts on slope stability, infrastructure and hydrological aspects. We also briefly describe the measurement techniques and modelling approaches applied. The chapter closes with a summary of the most important open research questions. The literature cited mainly includes studies on mountain permafrost published in scientific journals and assessments of long-term observation data. We focus on permafrost hydrology interactions wherever information is available. However, systematic studies on permafrost hydrology in mountain areas are still limited.22 years ago
- Number of stems of all living and dead trees and shrubs starting at 12 cm dbh recorded according to the NFI1 method. In NFI1 only those dead trees were recorded whose wood could still be exploited. __Citation:__ > _Abegg, M.; Brändli, U.-B.; Cioldi, F.; Fischer, C.; Herold-Bonardi, A.; Huber M.; Keller, M.; Meile, R.; Rösler, E.; Speich, S.; Traub, B.; Vidondo, B. (2014). Fourth national forest inventory - result tables and maps on the Internet for the NFI 2009-2013 (NFI4b). [Published online 06.11.2014] Available from World Wide Web http://www.lfi.ch/resultate/ Birmensdorf, Swiss Federal Research Institute WSL. [doi:10.21258/1057112](https://doi.org/10.21258/1057112)_12 years ago
- Rufiberg is a pre-alpine meadow site in Switzerland where shallow landslides have been observed after past intense rain storms. In order to assess the triggering mechanisms of these landslides, a comprehensive investigation was conducted within the project TRAMM from Nov 2009 to Oct 2012. It included meteorological observations, soil moisture measurements, bedrock groundwater measurements. The Rufiberg is located at the NW side of the Gnipen to the north of the village Arth-Goldau in the Canton of Schwyz. In the summer months, the site is used for pasturing. Usually, from December to March a snow cover is present at the Rufiberg. The site is at an altitude between 1080 – 1180 m asl, is ENE oriented, and has an average slope of 30 -35°. The Subalpine Molasse in the region is inclined with 30 - 35° to SE. In the area of the field site, beds of conglomerate with several m of thickness alter with beds of sandstone and marlstone. A ca. 2 – 5 m thick eluvium/colluvium layer composed of silty and sandy clay covers the bedrock. This site has been chosen because on one hand, during heavy rainfall events, e.g. autumn 2005, numerous landslides occur in the region of the Gnipen and the Rufiberg. On the other hand, the Rufiberg is very appropriate for experiments due its location away from infrastructures and due to its accessibility. The goal of the investigation was to understand the hydrology and hydrogeology of the slope with regard to shallow landslides. More information: Brönnimann, C., Stähli, M., Schneider, P., Seward, L. and Springman, S.M. 2013. Bedrock exfiltration as a triggering mechanism for shallow landslides. Water Resources Research, 49 (9): 5155–5167. DOI: 10.1002/wrcr.20386.42 years ago
- This dataset contains all snow, canopy and meteorological data presented and used in the publication: Mazzotti, G., Essery, R., Moeser, D. & Jonas T. (2020) 'Resolving spatial variability of forest snow using an energy-balance model with a 1-layer canopy'. Water Resources Research, https://doi.org/10.1029/2019WR026129. This publication must be cited when using this dataset.62 years ago
- Length of the forest edge calculated on the basis of the forest boundary lines determined in the aerial photo. __Citation:__ > _Abegg, M.; Brändli, U.-B.; Cioldi, F.; Fischer, C.; Herold-Bonardi, A.; Huber M.; Keller, M.; Meile, R.; Rösler, E.; Speich, S.; Traub, B.; Vidondo, B. (2014). Fourth national forest inventory - result tables and maps on the Internet for the NFI 2009-2013 (NFI4b). [Published online 06.11.2014] Available from World Wide Web http://www.lfi.ch/resultate/ Birmensdorf, Swiss Federal Research Institute WSL. [doi:10.21258/1057112](https://doi.org/10.21258/1057112)_22 years ago
- A laser optical disdrometer (Parsivel² , OTT Hydromet) was deployed at Gotschnagrat (LON: 9.849, LAT: 46.859) to measure hydrometeors by extinction when passing a laser beam. The instrument can classify eight different kinds of precipitation, including rain, hail, snow, drizzle, and hybrid forms. The dataset contains information on precipitation amount and type for the period of February 11 to March 27 2019 at Gotschnagrat.12 years ago
- 943 disturbances in the forest of southern Switzerland have been visited and characterized with various general and specific parameters and the presence absence of woody neophyte species has also been recorded. A Generalized linear regression modelling approach with a binomial family (link function “logit”) was then used to analyse the effects of these parameters on the presence/absence of the six most widespread neophyte species separately (i.e Ailanthus altissima, Buddleja davidii, R. pseudoacacia, Paulownia tomentosa, Prunus laurocerasus, Trachycarpus fortunei). The best model for every species have been used to predict the risk of invasion on a 25 X 25m grid of 1’773’603 million of points covering the entire forest area under 1’500 m a.s.l. Predictions over this new set of points have been computed with the predict function (v4.2.1; R core Team, 2023) and using the best select model for every neophyte species. The resulting prediction are available as a raster tiff. These presence probability risk maps for the forest area of the entire canton Ticino provide a practical tool to be used in combination with the waldmonitoring.ch data allowing to efficiently monitor the spread of woody neophyte species in new disturbances in the forest.22 years ago
- Notice: Changes to the dataset are still possible. Please do not use this dataset until the final publication with a DOI. Contact the authors if you have questions about this. This dataset contains measurements of stable water isotopes in snow and vapor on the Weissfluhjoch from different field campaigns (Winter 2017 (Trachsel, 2019), January 2020, December 2020, and March 2021 (Sadowski et al., 2022). Snow profiles and surface samples are available at different frequencies for each campaign. Please see "Data_description.pdf" for details. Scripts and SNOWPACK simulations used in (Trachsel, 2019) and (Sadowski et al., 2022) are also provided.62 years ago
- The dataset contains time series of water levels and precipitation measured in the Erlenbach catchment and its vicinity in summer and autumn 2021. Moreover, the dataset contains a time series of flowing drainage network lengths calculated using the CEASE method developed by authors. Detailed description of the dataset is provided in the documentation.32 years ago
- Species range limits are expected to be dramatically altered under future climate change and many species are predicted to shift their distribution upslope to track their suitable conditions (i.e. based on their niche). However, there might be large discrepancies between the speed of the upward shift of the climatic niche and the actual migration velocity of the species, especially in long-lived organisms such as trees. Here, we compared the simulations of the upslope displacement of the bioclimatic envelope of 16 tree species inhabiting temperate mountain forests under ongoing and future climate change obtained by correlative species distribution models (SDMs) to those from a dynamic forest model accounting for dispersal, competition and demography. We then partitioned the discrepancy in upslope migration velocity between the SDMs and the dynamic forest model into different components by manipulating dispersal limitation, interspecific competition and demography. This dataset contains the calibration and evaluation data used to create the bioclimatic envelope models, the predictors for the future scenarios (raster layers) and the bioclimatic input data used in the dynamic forest models used in the following publication (Scherrer et al. 2020). Paper Citation: Scherrer, D., Vitasse, Y., Guisan , A., Wohlgemuth, T., & Lischke, H. (2020). Competition and demography rather than dispersal limitation slow down upward shifts of trees’ upper elevation limits in the Alps. Journal of Ecology, in press.32 years ago
- Laboratory experiments are presented on the phase change at the surface of sodium chloride – water mixtures at temperatures between 259 K and 240 K. High selectivity to the upper few nanometres of the frozen solution – air interface is achieved by using electron yield near-edge X-ray absorption fine structure (NEXAFS) spectroscopy. We present the NEXAFS spectrum of the hydrohalite.152 years ago
- Assessment of coarse woody debris on Sanasilva plots (16x16 km grid) using the full count methods on subplots applying BioSoil protocoll ### Purpose: ### Assessing the amount of coarse woody debris ### Manual Citation: ### * A. Bastrup-Birk, P. Nevile, G. Chirici, T. Houston, 2006: The BioSoil ForestBiodiversity Field Manual Version 1.0/1.1/1.1A for the Field Assessment 2006-07. Working Group on ForestBiodiversity, Forest Focus Demonstration Project BioSoil 2004-2005, 47 S.12 years ago
- The files refer to the data used in Scherrer et al. (2021) "Canopy disturbances catalyse tree species shifts in Swiss forests" in _Ecosystems_. The two data files contain information about site factors (e.g. disturbance events, dominant tree species, elevation) and species-specific biomass of 5521 plots of the Swiss National Forest Inventory visited during the second (NFI2 1993-1995) and fourth (NFI4 2009-2017) inventory. In addition, we provide all the R-scripts necessary to reproduce the Figures and data tables of the related publication. For more detailed information about the data files please check the ReadMe.docx file.42 years ago
- For each natural hazard process according to FOEN’s SilvaProtectCH, the size of the forest area affected is given. One forest region may be affected by several different natural hazard processes and may thus contribute to the forest area affected by several different natural hazard processes. __Citation:__ > _Abegg, M.; Brändli, U.-B.; Cioldi, F.; Fischer, C.; Herold-Bonardi, A.; Huber M.; Keller, M.; Meile, R.; Rösler, E.; Speich, S.; Traub, B.; Vidondo, B. (2014). Fourth national forest inventory - result tables and maps on the Internet for the NFI 2009-2013 (NFI4b). [Published online 06.11.2014] Available from World Wide Web http://www.lfi.ch/resultate/ Birmensdorf, Swiss Federal Research Institute WSL. [doi:10.21258/1057112](https://doi.org/10.21258/1057112)_42 years ago
- Cities are socio-ecological systems that filter and select species, thus establishing unique species assemblages and biotic interactions. Urban ecosystems can host richer wild bee communities than highly intensified agricultural areas, specifically in resource-rich urban green spaces such as allotment and family gardens. At the same time, urban beekeeping has boomed in many European cities, raising concerns that the fast addition of a large number of managed bees could deplete the existing floral resources, triggering competition between wild bees and honeybees. The data has been used to investigated the interplay between resource availability and the number of honeybees at local and landscape scales and how this relationship influences wild bee diversity. This dataset contains the raw and processed data supporting the findings from the paper: "Low resource availability drives feeding niche partitioning between wild bees and honeybees in a European city". The data contains: 1. Bee trait measurements at the species and individual-level of five functional traits. 2. The values of the feeding niche partitioning (functional dissimilarity to honeybees) 3. The predictors of resource availability and beekeeping intensity at local and landscape scales used in the modelling of the paper for the 23 experimental sites.52 years ago
- This data set includes 54 years of hydrometeorological measurements from small (first-order) catchments in the pre-alpine valley Alptal. Here we provide daily mean values; values in sub-daily resolution can be provided on demand. Runoff has been measured at the outlet of three small (first-order) catchments of approximately 1 km2 area: Erlenbach (two independent runoff measurements), Vogelbach and Lümpenenbach. The catchments are similar with regard to geology (Flysch) and soil conditions (clay soils), but differ in forest coverage (20 to 60%). A detailed description of the catchments can be found at https://www.wsl.ch/alptal . Runoff in these small catchments is typically very dynamic and can temporally carry large amounts of sediment and large wood. Thus, the accuracy of the measurements at very large flow is limited. Meteorological variables have been measured on a meadow (Erlenhöhe) located in the Erlenbach catchment at 1220 m a.s.l. using a standard meteorological station (incl. ventilated air temperature and heated rain gauges). In addition, precipitation has also been recorded at two other locations (in the Vogelbach and Lümpenenbach catchments). Snow measurements have been conducted weekly to monthly since 1968 at more than 15 locations (30-m transects) representing different altitudes, aspects and land uses (meadow, forest). In addition, snow depth has been recorded continuously since 2003 at Erlenhöhe, and for this location we also include a simulation of snow depth and SWE (using the numerical models COUP and DeltaSnow) that assimilates the manual weekly snow-course measurements. Details on these snow measurements can be found in Stähli, M. and Gustafsson, D. 2006. Hydrol. Proc., 20, 411-428. doi: 10.1002/hyp.6058. Further information on the methods and sensors can be found at https://www.wsl.ch/alptal . A first version of this data set (for the period 1968-2017) was uploaded in June 2018 at the occasion of the 50-year anniversary. This original data set was updated in February 2021 (with data from 2018 and 2019), and this data set was used for a longterm trend analysis, submitted for publication in a special issue of Hydrological Processes. A second update of the data set (with data from 2020 to 2022) was uploaded in March 2023.32 years ago
- We performed an experimental trilogy of induced rockfall experiments in a spruce stand in Surava (CH) within (i) the original forest, (ii) after a logging job, resulting in lying deadwood and (iii) the cleared, deadwwod-free state. The three experimental set-ups allow quantifying the deadwood effect on overall rockfall risk for the same forest (slope, species) in three different conditions.102 years ago
- Continuous measurement of soil water content at 15, 50 and 80 cm depth (3 replications) with ECH2O EC-5 soil moisture probes (Decagon Incorporation, Pullman, WA, USA). ### Purpose: ### Improve the available data for the calibration or validation of the water cycle modells, i.e. the determination of the water flux needed for calculating the leaching fluxes.12 years ago
- ## In Memory of Dr. Konrad (Koni) Steffen Update October 2022: The GC-Net is kindly continued by the Geological Survey of Denmark and Greenland (GEUS). Starting October 3, 2022, the access to the latest versions of the "ready to use" L1 data has been migrated to GEUS. Future data versions will be available at: [https://doi.org/10.22008/FK2/VVXGUT](https://doi.org/10.22008/FK2/VVXGUT) ### Background Starting with a single station in 1991, the Greenland Climate Network (commonly known as GC-Net) is a set of Automatic Weather Stations (AWS) set up and managed by the late Prof. Dr. Konrad (Koni) Steffen, and spanning the Greenland Ice Sheet (GrIS). This first station was "Swiss Camp" or the "ETH-CU" camp (GC-Net station #01) which was used as a field science and education site by Koni for years. The GC-Net was expanded with multiple NASA, NOAA, and NSF grants throughout the years, and then supported by WSL in the later years. These data (see "C-file" below) were previously hosted by the Cooperative Institute for Research in Environmental Sciences (CIRES) in Boulder, Colorado. ### Overview Provided in this dataset are the 16 longest running stations in the network, which are spread over a significant area of the GrIS and the majority of the unique climatic zones. From the South Dome high point in the South, to the Western Jakobshavn ablation region in the west, to the Petermann glacier in the North across east of the Northeast Greenland Ice Stream to the east, GC-Net is the longest running climatological record of Greenland. ### The standard GC-Net station consists of: * Air temperature measurements at 2 heights above the surface * Temperature and humidity measurements at 2 heights above the surface * Wind speed and direction measured at 2 heights above the surface * Sonic distance sounder measurements for 2 snow height and distance of instruments to surface * Incoming shortwave radiation measurement * Reflected shortwave radiation measurement * Net broadband radiation (long- and short-wave) measurement * Air pressure measurement Data have often been repatriated in near-real time using one of either the GOES geostationary satellite or the ARGOS polar orbiting satellite transmission system. The stations were visited typically every 1-2 years for maintenance and service, and to download full uncorrupted data directly from the dataloggers. GC-Net stations were visited by Twin Otter equipped with snow skids to land directly on the open-ice at the AWS locations, or by helicopter near the west coast. The AWSs operate on solar and battery power and occasionally lost power during the dark and cold winter months, particularly when the batteries were aging. ### Dataset This dataset consists of 2 main data levels; Level 0 and Level 1. Level 0 is the raw data from the dataloggers, historical processing codes, satellite transmissions, and Koni’s personal data archive. Level 0 data (.zip) directories contain subdirectories: * “C file” - contains the historical processed datafile for each station. * “Campbell logger files” - contains the raw csv datafiles from the stations’ Campbell Scientific dataloggers since the CR1000 era (~2007-2008 for most stations). * “Photos” - contains photographs of the station when available marked by year. Level 1 is the appended, calibrated, cleaned, and quality flagged data. The full processing scheme is open-source and publicly available on the following GitHub repository (please also check GitHub for the latest L1 data): [GC-Net L1 data on GitHub](https://github.com/GEUS-Glaciology-and-Climate/GC-Net-level-1-data-processing "GC-Net-level-1-data-processing") Level 1 data is provided in the newly described csv-compatible [NEAD format](https://www.envidat.ch/#/metadata/nead "NEAD format"). ### Additional Details Dataset description publication will be forthcoming. The Geological Survey of Denmark and Greenland (GEUS) has been imperative in the reprocessing and continuity mission of GC-Net. Multiple GC-Net stations have been replaced with updated and upgraded AWS hardware at the same coordinates by GEUS. This effort will ensure continuity of the GC-Net dataset into the future.212 years ago
- This questionnaire survey was conducted as an online survey and aimed at investigating the relationship between physical forest characteristics, visual attractiveness of forest and the perception of ecological and cultural ecosystem services in urban forests. Each participant was shown 6 photos out of a pool of 50 photos taken from the Swiss National Forest Inventory (NFI) database. Physical forest characteristics were derived from the photos. The study was conducted as part of the "WaMos meets LFI" (WML) project.62 years ago
- Fortnightly measurement of the soil solution chemistry in 4 soil depths with zero-tension lysimeter below the litter layer and with tension lysimeters at depths of 15, 50 and 80 cm (8 replicates) ### Purpose: ### To characterize the chemical status of the soil solution and to detect trends in soil water quality. To assess the effects of air pollution and climate chnage on soil water quality. ### Manual Citation: ### * Micha Pluess, Daniel Christen, 1999: Kurzanleitung Bodenlösung. Langfristige Waldökosystem-Forschung LWF, Birmensdorf, 2 S. * Nieminen TM, De Vos B, Cools N, König N, Fischer R, Iost S, Meesenburg H, Nicolas M, O’Dea P, Cecchini G, Ferretti M, De La Cruz A, Derome K, Lindroos AJ, Graf Pannatier E, 2016: Part XI: Soil Solution Collection and Analysis. In: UNECE ICP Forests Programme Co-ordinating Centre (ed.): Manual on methods and criteria for harmonized sampling, assessment, monitoring and analysis of the effects of air pollution on forests. Thünen Institute of Forest Ecosystems, Eberswalde, Germany, 20 p. + Annex [http://icp-forests.net/page/icp-forests-manual](http://icp-forests.net/page/icp-forests-manual) ### Paper Citation: ### * Graf Pannatier, E.; Thimonier, A.; Schmitt, M.; Walthert, L.; Waldner, P., 2011: A decade of monitoring at Swiss Long-Term Forest Ecosystem Research (LWF) sites: can we observe trends in atmospheric acid deposition and in soil solution acidity?. Environmental Monitoring and Assessment, 174, 1-4: 3-30. [doi: 10.1007/s10661-010-1754-3](http://doi.org/10.1007/s10661-010-1754-3)12 years ago
- Ecologically meaningful predictors are often neglected in plant distribution studies, resulting in incomplete niche quantification and low predictive power of species distribution models (SDMs). Because environmental data are rare and expensive to collect, and because their relationship with local climatic and topographic conditions are complex, mapping them over large geographic extents and at high spatial resolution remains a major challenge. Here, we derived environmental data layers by mapping ecological indicator values (EIVs) in space by using a large set of environmental predictors in Switzerland. This dataset contains the predictors (raster layers) generated and used in the following publication (Descombes et al. 2020). Only predictors for which we have the rights to share them are provided. Other datasets and predictors can be accessed via the original data provider. Details on the predictors and sources are fully described in the publication. The predictors are provided as GeoTIFF files, at 93 m spatial resolution and Mercator projection ("+proj=merc +lon_0=0 +k=1 +x_0=0 +y_0=0 +ellps=WGS84 +towgs84=0,0,0,0,0,0,0 +units=m +no_defs"). The excel file (xlsx) provides a short description of the raster layers. Paper Citation: Descombes, P. et al. (2020). Spatial modelling of ecological indicator values improves predictions of plant distributions in complex landscapes. Ecography. (accepted)22 years ago
-  LWF Plot Nationalpark - Community: Zernez / canton GR - Date of installation: 10 October 1995 - Size of the plot: 2 ha - Altitude: 1890-1907 m - Mean slope: 11% - Geology (in German): Nacheiszeitlicher Schwemmfächer; kalkhaltige Moräne, Dolomite, Kalke, Tonschiefer, Rauhwacken - Provisional soil types (WSL): Rendzic Leptosol - Woodland association after EK72: 67: Erico-Pinetum montanae - Main tree species: Pinus mugo - Management system: high forest - Silvicultural system: forest reserve - Top-height diameter (quadratic average diameter of the 100 thickest trees per ha): 23.7 cm - Number of trees BHD >= 12 cm (2011): 2450 - Maximum tree age: Pinus mugo 210 yr More Information: https://www.wsl.ch/en/forest/forest-development-and-monitoring/long-term-forest-ecosystem-research-lwf/sites/nationalpark.html22 years ago
- 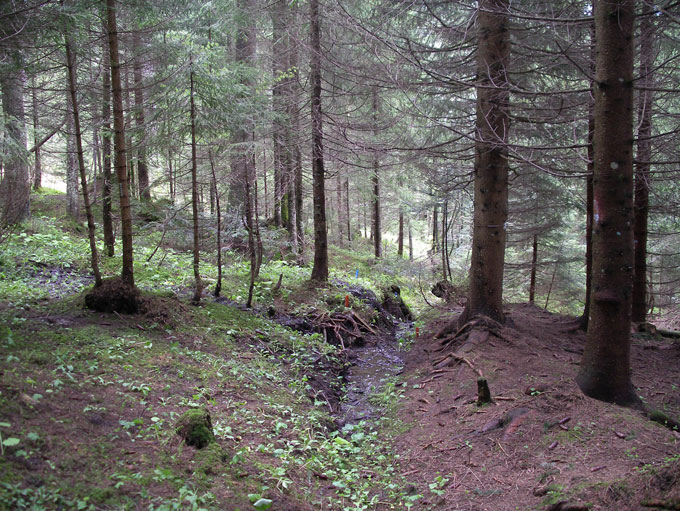 LWF plot Alptal - Community: Alpthal / canton SZ - Date of installation: 31 May 1995 - Size of the plot: 0.6 ha - Altitude: 1149-1170 m - Mean slope: 23% - Geology (in German): Nordpenninikum; obere Kreide-unteres Eozän, Wägitaler Flysch - Soil types (WSL) : Mollic Gleysols, Gleyic Cambisols - Woodland association after EK72: 49: Equiseto-Abietetum - Main tree species: Picea abies - Management system: high forest - Silvicultural system: selection - Top-height diameter (quadratic average diameter of the 100 thickest trees per ha): 39.3 cm - Number of trees BHD >= 12 cm (2011): 321 - Maximum tree age: Picea abies 180-230 yr More Information: https://www.wsl.ch/en/forest/forest-development-and-monitoring/long-term-forest-ecosystem-research-lwf/sites/alptal.html32 years ago
- The European Snow Booklet (ESB) is a book of reference for snow measurements that has been produced through collaboration with many European snow practitioners and snow scientists in the framework of the European Cooperation in Science and Technology (COST) Action ES1404 “A European network for a harmonised monitoring of snow for the benefit of climate change scenarios, hydrology and numerical weather prediction (HarmoSnow)”. The ESB provides a unique collection of information about operational snow observations in the European countries and the methods used to perform basic measurements of snow on the ground: snow depth (HS), depth of snowfall (HN), water equivalent of the snow cover (SWE) and presence of snow on the ground (PSG). Information and station metadata (for example location, elevation) for these basic snow variables were collected through a comprehensive survey, the ESB questionnaire between August 2017 and March 2018. Numerous institutions of 38 European countries provided detailed information describing the status of the operational snow observations and the methods used at the time of the survey. Based on the information provided, a country report was written for each European country. Similarities and differences among the countries, that is, the choice of snow variables to be measured, the measurement principles applied, the number of stations, or the spatial and elevational station distribution are pointed out. Thus the collection of country reports demonstrates the relevance of snow measurements for each country. Thus, the intention of the ESB is to foster better knowledge transfer regarding snow measurements between the snow science and operational communities and to improve the communication of information to the general public. For detailed information on the European countries, we refer to the ESB, which can be downloaded here (envidat.ch). Please note that the ESB is not a living document and information and station metadata are from August 2017 till March 2018, except for Latvia (metadata updated in December 2018).52 years ago
- The R script eemma.R, which implements Ensemble End-Member Mixing Analysis (EEMMA) to estimate source fractions in mixtures, exploiting information contained in time-series correlations among tracer time series. A brief user's guide, a demonstration script, and a demonstration data set are also provided, to accompany Kirchner, J.W., Mixing models with multiple, overlapping, or incomplete end-members, quantified using time series of a single tracer, Geophysical Research Letters, 2023. The user's guide is available for public use under Creative Commons CC-BY-SA. Public use of the scripts is permitted under GNU General Public License 3 (GPL3); for details see https://www.gnu.org/licenses/42 years ago
- Since 2001 soil water content and soil water potential are measured in 40 plots of the *[Intercantonal Forest Observation Program](https://www.envidat.ch/dataset/interkantonale-walddauerbeobachtung-wdb)*. Soil water content and soil water potential is measured in hourly resolution in 3 depths according to the soil horizons. The following parameters about soil water balance are measured: * Volumetric soil water content (SMT-100, Truebner) * Soil water potential (TEROS21, METER) More information about the analytical methods and results can be found in *[Braun et al. (2021)](https://doi.org/10.5281/zenodo.5724756)*.12 years ago
- This dataset comprises the climatology on gridded data of snow water equivalent and snow melt runoff spanning 1998-2022, with a spatial resolution of 1 km and daily temporal resolution. This data was produced with the conceptual OSHD model (Temperature Index Model).12 years ago
- The Bryophytes of Europe Traits (BET) dataset includes values for 65 biological and ecological traits and 25 bioclimatic variables for all 1816 bryophytes included in the European Red List (Hodgetts et al. 2019). The traits are compiled from several regional trait datasets and manually complemented using Floras, species-specific literature and expert knowledge. The bioclimatic variables are calculated using the European range of each species. Details regarding the trait compilation and extraction of bioclimatic variables can be found in the corresponding data paper (Van Zuijlen et al. 2023).32 years ago
- The IAP has been monitoring forest health since 1984 on behalf of cantonal forest and environmental offices and in collaboration with the Federal Office for the Environment. In the Intercantonal Forest Observation Program (WDB) project, the health, growth and nutrient supply of beech, spruce and oak in managed forest ecosystems are studied on about 190 forest plots. The plots cover the most important gradients of Swiss forests, such as different climatic conditions in precipitation, temperature, as well as differences in soil and in the input of air pollutants such as nitrogen and ozone. Currently (date 2020) 94 plots with 6268 beech trees, 75 plots with 4547 spruce trees, and 50 plots with 1858 oak trees are surveyed in the Intercantonal WDB. Annual investigations include crown condition and tree loss by mortality, uprooting and stem breakage. Every 4 year stem increment is measured on all 12’673 trees and 8 branches are harvested by helicopter very 4 years and subsequently examined for the following parameters: - Nutrient analysis in foliage (N, P, K, Ca, Mg, Mn) - Leaf area and weight - Shoot growth (retrospective for Norway spruce, beech and oak) - Discoloration and parasite infestation - Fructification of beech (retrospectively) In addition, soil samples for analysing the chemistry of the solid phase are taken every 12 years. Also changes in the ground vegetation is assessed every 12 years. On a subset of the plots soil solution is sampled monthly *[(Soil solution monitoring of the Intercantonal Forest Observation Program)](https://www.envidat.ch/dataset/soil-solution-monitoring-of-the-intercantonal-forest-observation-program)*. In addition, soil water potential and soil moisture are measured in a subset of sites of the Intercantonal Forest Observation Program *[(Soil moisture and soil water potential measurements of the Intercantonal Forest Observation Program)](https://www.envidat.ch/dataset/soil-water-measurements-wdb)*. These data allow to gain a unique understanding of the main factors influencing the forest and the most important changes, which are very valuable especially in the context of climate change. The insights are of great importance for cantonal and regional forest planning as well as for national and international determinations of critical loads and limits (e.g. CLempN, UNECE CLRTAP).22 years ago
- In 1989 a nation-wide survey on spruce seed and cone insects was carried out at 29 locations distributed across the 5 main geographic regions of Switzerland. The cones were incubated in a controlled environment chamber and the emerging insects were collected and identified. The cones were kept for three years to allow diapausing insects to emerge. The methods are described in more detail in the corresponding publications.12 years ago
- Hymenopteran data from all historic up to the recent projects (29.10.2019) of WSL, collected with various standardized methods in landscapes of different types. Data are provided on request to contact person against bilateral agreement.22 years ago
- Two raster maps (10m resolution) of: I) the most suitable extraction method for wood in the Swiss forest, and II) the overall suitability of the Swiss forest for economic wood extraction and transport. A modern forest road system is important for the efficient management of forests. In order to assess the current forest accessibility in Switzerland on a comprehensive basis, the entire Swiss forest was investigated using a consistent methodology. In our model, wood extraction from the stand to the road and on-road transport are analysed in combination. Suitable extraction methods for each forest parcel (10m x 10m) were determined using an approach in which ground-based, cable-based and air-based transport are distinguished. First, the areas for ground- and cable-based extraction were delineated. The trafficability of the forest areas was assessed based on the terrain and soil characteristics; trafficable areas also had to be connected to a forest road. To evaluate the suitability for cable-yarding (up to a maximum distance of 1500 m), terrain and possible obstacles (e.g., power lines) were considered. The remaining forest area, which was not suitable for either ground-based or cable-based methods, was assigned to the "helicopter" category. As a result of this analysis, a map of the most suitable skidding method for each plot could be created. When several methods were possible for a parcel, the priority was ground-based over cable-based over air-based. Road transport was investigated using network analysis, based on the data set "Forest access roads 2013" from the Swiss National Forest Inventory (NFI), which contains information on width and weight limits of roads in the forest and up to the superordinate main road network. Thus, in addition to the distance, the largest type of vehicle allowed on the respective removal route could also be taken into account. Based on the extraction method and the weight limits for on-road transport, the forest area was divided into three categories: 1) meets the requirements for efficient forest management (all forest parcels with ground-based extraction method or mobile cable-yarding, transport weight limit at least 28 tons); 2) limited suitability for efficient forest management; and 3) not suitable for efficient forest management (forest parcels in the "helicopter" category or transport with trucks under 26 tons). The resulting maps cannot provide an accurate classification for each forest parcel. Missing or incorrect roads in the road dataset, insufficient information on ground trafficability or other local factors, the limitation to only three possible extraction systems, and failure to account for anchor trees, extraction methods changing over small distances, and unrealistically short cable-yarding distances can cause the model results to deviate from the assessment by an expert with knowledge of the local conditions. Also, protected areas were not excluded and harvesting intensity was not taken into account. The advantage of the method is that consistent criteria are used for the entire Swiss forest, making the results comparable throughout Switzerland. The data are managed at the Swiss Federal Institute for Forest, Snow and Landscape Research (WSL) and are available to third parties on request. (NFI data policy: https://www.lfi.ch/dienstleist/daten.php) Input data used: - Forest road dataset of the NFI4 (only truck roads from 3.0 m width and 26 t carrying capacity) (2016). - NFI forest mask, 10 m resolution (2015) - Digital elevation model, 10m resolution (based on swissALTI3D 2016) - Slope map, 10m resolution (based on swissALTI3D 2016) - Soil suitability map, 10m resolution (based on soil suitability map BFS 2000) - Obstacles for cable lines, 10m resolution (buildings, major roads, power lines, railroads, based on swissTLM3D 2016)22 years ago
- Dry weight (mass) of branches with a diameter under 7 cm from living trees and shrubs starting at 12cm dbh. __Citation:__ > _Abegg, M.; Brändli, U.-B.; Cioldi, F.; Fischer, C.; Herold-Bonardi, A.; Huber M.; Keller, M.; Meile, R.; Rösler, E.; Speich, S.; Traub, B.; Vidondo, B. (2014). Fourth national forest inventory - result tables and maps on the Internet for the NFI 2009-2013 (NFI4b). [Published online 06.11.2014] Available from World Wide Web http://www.lfi.ch/resultate/ Birmensdorf, Swiss Federal Research Institute WSL. [doi:10.21258/1057112](https://doi.org/10.21258/1057112)_22 years ago
- Long-term (1980-2011) average annual precipitation (pcp_ch_longterm_yr_avg.tif) and potential evapotranspiration (pet_ch_longterm_yr_avg.tif) at 500m resolution. Units are mm per year. Files are GeoTIFF rasters, and can be read in R using the command raster("pcp_ch_longterm_yr_avg.tif), after installing packages "raster" and "rgdal".22 years ago
- The files contain the datasets used to produce Figures 2, 3, and 4 of the manuscript ([doi: 10.1002/2016GL071822](http://dx.doi.org/10.1002/2016GL071822)). ## Manuscript Abstract: Despite being the main sediment entrainment mechanism in aeolian transport, granular splash is still poorly understood. We provide a deeper insight into the dynamics of sand and snow ejection with a stochastic model derived from the energy and momentum conservation laws. Our analysis highlights that the ejection regime of uniform sand is inherently different from that of heterogeneous sand. Moreover, we show that cohesive snow presents a mixed ejection regime, statistically controlled either by energy or momentum conservation depending on the impact velocity. The proposed formulation can provide a solid base for granular splash simulations in saltation models, leading to more reliable assessments of aeolian transport on Earth and Mars.52 years ago
- The Swiss FluxNet Site Lägeren is a managed mixed deciduous mountain forest located on the steep Lägeren mountain (NW of Zurich, Swiss Plateau). The forest is highly diverse, dominated by beech, but also including ash, maple, spruce and fir trees. Eddy covariance flux measurements were started in April 2004. The site was part of the international CarboEurope IP network and the National Air Pollution Monitoring Network (NABEL). In addition to Swiss FluxNet, the site is part of the Long-term Forest Ecosystem Research (LWF) of WSL and the biological drought and growth indicator network (TreeNet) of WSL. __Measurements__ - Ecosystem flux measurements of CO2, H2O vapour are performed with the eddy-covariance method. This method is based on measurements of trace gas mixing ratios, using infrared gas analyzers (for CO2, H2O vapor), combined with wind speed and wind direction measurements, using 3D sonic anemometers. To resolve the short-term turbulent fluctuations in the atmosphere, very fast measurements are needed: we measure at 10-20 Hz, i.e., 10-20 times per second. To assess the energy budget of each ecosystem, also radiation sensors and soil climate profiles are installed at the site. - Sub-canopy eddy fluxes (CO2, H2O), soil respiration campaigns - Continuous CO2 profile measurements. - Auxiliary micrometeorology and soil climate measurements. __Data availability__ All data are available from the European Fluxes Database Cluster, but are also part of Fluxnet2015 dataset. __Data policy__ ICOS data license: [https://www.icos-cp.eu/data-services/about-data-portal/data-license](https://www.icos-cp.eu/data-services/about-data-portal/data-license) __Detailed site info__: [https://www.swissfluxnet.ethz.ch/index.php/sites/ch-lae-laegeren/site-info-ch-lae//](https://www.swissfluxnet.ethz.ch/index.php/sites/ch-lae-laegeren/site-info-ch-lae/)32 years ago
-  LWF Plot Jussy - Community: Jussy / canton GE - Date of installation: 31 May 1995 - Size of the plot: 1.99 ha - Altitude: 496-506 m - Mean slope: 3% - Geology (in German): Quartär; tonreiche würmeiszeitliche Grundmoräne - Soil types (WSL) : Stagnic Luvisols - Woodland association after EK72: 35: Galio silvatici-Carpinetum - Main tree species: Quercus species - Management system: former coppices w. standards - Silvicultural system: unmanaged / group selection - Top-height diameter (quadratic average diameter of the 100 thickest trees per ha): 36.6 cm - Number of trees BHD >= 12 cm (2011): 1278 - Maximum tree age: Carpinus betulus 60 yr - Populus tremula 60 yr - Quercus petrea 90 yr More Information: https://www.wsl.ch/en/forest/forest-development-and-monitoring/long-term-forest-ecosystem-research-lwf/sites/jussy.html22 years ago
- These are condensed notes covering selected key points in data analysis and statistics. They were developed by James Kirchner for the course "Analysis of Environmental Data" at Berkeley in the 1990's and 2000's. They are not intended to be comprehensive, and thus are not a substitute for a good textbook or a good education! License: These notes are released by James Kirchner under a Creative Commons Attribution-ShareAlike 4.0 International (CC BY-SA 4.0) license.122 years ago
- A present weather sensor (Vaisala PWD22) was deployed in Klosters (LON: 9.880413, LAT: 46.869019) for weather observation, combining the functions of a forwardscatter visibility meter and a present weather sensor. Besides measuring ambient light, it detects the intensity as well as the amount of both liquid and solid precipitation. More information can be found in the [User's Manual](ftp://ftp.cmdl.noaa.gov/aerosol/doc/manuals/PWD22_Manual.pdf).12 years ago
- Volume of stemwood with bark of all trees and shrubs starting at 12 cm dbh that were felled, died or disappeared between two inventories. The correction for bias with the sample Tarif trees may be so drastic that it results in negative values with small numbers of trees. __Citation:__ > _Abegg, M.; Brändli, U.-B.; Cioldi, F.; Fischer, C.; Herold-Bonardi, A.; Huber M.; Keller, M.; Meile, R.; Rösler, E.; Speich, S.; Traub, B.; Vidondo, B. (2014). Fourth national forest inventory - result tables and maps on the Internet for the NFI 2009-2013 (NFI4b). [Published online 06.11.2014] Available from World Wide Web http://www.lfi.ch/resultate/ Birmensdorf, Swiss Federal Research Institute WSL. [doi:10.21258/1057112](https://doi.org/10.21258/1057112)_32 years ago
- The dataset contains for three variables (snow water equivalent, surface water input and liquid precipitation) 50 realizations of current and future climate periods for two time horizons (mid end end of century), two emission senarions (RCP 4.5 and 8.5) and 10 climate model chains (all EUR11 chains within CH2018). To quantify natural climate variability for projections of snow conditions and resulting rain-on-snow (ROS) flood events, a weather generator was applied to simulate inherently consistent climate variables for multiple realizations of current and future climates at 100 m spatial and hourly temporal resolution over a 12 x 12 km high-altitude study area in the Swiss Alps. The output of the weather generator was used as input for subsequent simulations with an energy balance snow model. The data was extracted in 2021 from original model output.12 years ago
- NO₂ concentrations were measured at 11 LWF plots (1999/2000) with passive samplers (Palmes-type diffusion tubes) during one year. Three samplers per site and period (usually 14 days) were installed in the open area of the LWF plots and, at Beatenberg, Novaggio and Vordemwald, under the forest as well (weather station). In 2014, NO2 concentrations were measured again at 14 plots, using two samplers per site and period (usually 28 days). At Lausanne and Vordemwald, concentrations were also measured below the canopy. ### Purpose: ### To assess air concentrations of nitrogen dioxide (NO2) and, using deposition velocities available from the literature, to quantify the dry deposition of NO2 (alternative method to the throughfall method).12 years ago
- Corrected incoming and outgoing shortwave and longwave 2 min radiation measurements at the Weissfluhjoch summit, Davos, CH. ### References 1. Marty, C., Philipona, R., Frohlich, C., Ohmura, A.. Altitude dependence of surface radiation fluxes and cloud forcing in the alps: results from the alpine surface radiation budget network. 2002. Theoretical and Applied Climatology. Volume 72. Issue 3-4. 137-155. http://dx.doi.org/10.1007/s007040200019. 10.1007/s007040200019. 2. Christoph Marty. Surface Radiation, Cloud Forcing and Greenhouse Effect in the Alps. 2000. Institute fuer Klimaforschung ETH. Zuercher Klima-Schriften. Volume 79. http://e-collection.library.ethz.ch/eserv/eth:23491/eth-23491-01.pdf.42 years ago
- Throughfall (precipitation under forest canopy) is a major pathway in forest nutrient cycling, and its quantification is necessary to establish both water and nutrient budgets. Furthermore, parallel sampling of throughfall and precipitation in the open field (bulk precipitation), together with assumptions about the canopy exchange processes (uptake and leaching of nutrients), allow the atmospheric deposition of nutrients and pollutants to be quantifed. Bulk precipitation and throughfall have been sampled since 1994 or later on 15 LWF plots using 3 (in the open) and 16 (in the forest) funnel-type precipitation collectors. These collectors are replaced by 1 (open area) and 4 (forest stand) snow buckets in winter on plots with abundant precipitation in the form of snow. The length of sampling intervals is usually 14 days. ### Purpose: ### To assess a major flux of the water and nutrient budget in forests, and to quantify the atmospheric deposition of nitrogen, sulphur and other nutrients. Atmospheric deposition is one of the key factors in the causal chain between emission of air pollutants and acidifying or eutrophying effects in forest ecosystems. ### Manual Citation: ### * Thimonier, A., Brang, P., Wenger, K., 1997. Kapitel C4. Atmosphärische Deposition: Freiland- und Bestandesniederschläge, in: Brang, P. (Ed.), Aufnahmeanleitungen aller Forschungsprojekte auf Flächen der Langfristigen Waldökosystem-Forschung (LWF). Eidg. Forschungsanstalt WSL, Birmensdorf, pp. 1-48. * Clarke N, Žlindra D, Ulrich E, Mosello R, Derome J, Derome K, König N, Lövblad G, Draaijers GPJ, Hansen K, Thimonier A, Waldner P, 2016: Part XIV: Sampling and Analysis of Deposition. In: UNECE ICP Forests Programme Co-ordinating Centre (ed.): Manual on methods and criteria for harmonized sampling, assessment, monitoring and analysis of the effects of air pollution on forests. Thünen Institute of Forest Ecosystems, Eberswalde, Germany, 32 p. + Annex [http://icp-forests.net/page/icp-forests-manual](http://icp-forests.net/page/icp-forests-manual) ### Paper Citation: ### * Thimonier A, Schmitt M, Waldner P, Rihm B (2005) Atmospheric deposition on Swiss Long-term Forest Ecosystem Research (LWF) plots. Environmental Monitoring and Assessment, 104: 81-118. [doi: 10.1007/s10661-005-1605-9](http://doi.org/10.1007/s10661-005-1605-9) * Thimonier A, Kosonen Z, Braun S, Rihm B, Schleppi P, Schmitt M, Seitler E, Waldner P, Thöni L (2019) Total deposition of nitrogen in Swiss forests: Comparison of assessment methods and evaluation of changes over two decades. Atmospheric Environment, 198: 335-350. [doi: 10.1016/j.atmosenv.2018.10.051](http://doi.org/10.1016/j.atmosenv.2018.10.051)12 years ago
- Model code, technical documentation and auxiliary files for the dynamic ecohydrological model FORHYCS (FORests and HYdrology under Climate change in Switzerland). FORHYCS combines two pre-existing models, the hydrological model PREVAH and the forest landscape model TreeMig. License: GPL v342 years ago
- Ground vegetation is an important compartment of the ecosystem in terms of biodiversity and it takes an active part in the general functioning of the ecosystem. It is also a useful bio-indicator of the site conditions and its monitoring may enable the detection of environmental changes. Ground vegetation relevés were carried out repeatedly at 17 LWF plots during in the the period between 1994 and 2011. In 2013, ground vegetation was surveyed at an additional LWF plot (Laegeren). The cover of all plant species occurring in 16 1-m2 quadrats, distributed over the 43 x 43 m intensive monitoring subplot was visually assessed. Seedlings and saplings were also counted and their position within the quadrat was noted in order to assess tree regeneration. ### Purpose: ### To assess the species diversity of ground vegetation and detect possible environmental changes using its bio-indicator value. ### Manual Citation: ### * Kull, P., 1997. Kapitel D2. Vegetationsaufnahmen. In: Brang, P. (Ed.), Aufnahmeanleitungen aller Forschungsprojekte auf Flächen der Langfristigen Waldökosystem-Forschung (LWF). Eidg. Forschungsanstalt WSL, Birmensdorf, pp. 1-9. * Canullo R, Starlinger F, Granke O, Fischer R, Aamlid D, 2016: Part VI.1: Assessment of Ground Vegetation. In: UNECE ICP Forests Programme Co-ordinating Centre (ed.): Manual on methods and criteria for harmonized sampling, assessment, monitoring and analysis of the effects of air pollution on forests. Thünen Institute of Forest Ecosystems, Eberswalde, 12 p. + Annex [http://icp-forests.net/page/icp-forests-manual](http://icp-forests.net/page/icp-forests-manual) ### Paper Citation: ### * Thimonier A, Kull P, Keller W, Moser B, Wohlgemuth T (2011) Ground vegetation monitoring in Swiss forests: comparison of survey methods and implications for trend assessments. Environmental Monitoring and Assessment, 174: 47-63. [doi: 10.1007/s10661-010-1759-y](http://doi.org/10.1007/s10661-010-1759-y)12 years ago
- Sum of the stem cross-section areas of all dead trees in a stand at a height of 1.3 m (dbh measurement height). __Citation:__ > _Abegg, M.; Brändli, U.-B.; Cioldi, F.; Fischer, C.; Herold-Bonardi, A.; Huber M.; Keller, M.; Meile, R.; Rösler, E.; Speich, S.; Traub, B.; Vidondo, B. (2014). Fourth national forest inventory - result tables and maps on the Internet for the NFI 2009-2013 (NFI4b). [Published online 06.11.2014] Available from World Wide Web http://www.lfi.ch/resultate/ Birmensdorf, Swiss Federal Research Institute WSL. [doi:10.21258/1057112](https://doi.org/10.21258/1057112)_32 years ago
- The data consists of a forest visitor survey conducted at 50 plots in the whole of Switzerland, once during the winter- and once during the summer season. Physical forest characteristics according to the Swiss National Forest Inventory NFI were collected from the same plots in winter and summer. Visibility was measured using terrestrial laser scanning. At some plots, sound measurements were also conducted.82 years ago
- Decomposition of plant litter is a key process for the transfer of carbon and nutrients in ecosystems. Carbon contained in the decaying biomass is released to the atmosphere as respired CO2, and may contribute to global warming. Litterbag studies have been used to improve our knowledge of the drivers of litter decomposition, but they lack comparability because litter quality is plant species-specific. The use of commercial tea bags as a standard substrate was suggested in order to harmonize studies, where green tea and rooibos represent more labile and more recalcitrant C compounds as surrogates of local litter. The tea bag approach was implemented on eight sites of the Swiss long-term Forest Ecosystem Research (LWF) network (https://www.wsl.ch/LWF). This allowed us to take advantage from the existing infrastructure and data from a previous litterbag study with local litter. In Beatenberg and Schaenis, additional elevation transects were established (1200-1800 m and 540-1150 m, respectively) to examine particularly the effect of temperature on decomposition. In Pfynwald (https://www.wsl.ch/de/ueber-die-wsl/versuchsanlagen-und-labors/flaechen-im-wald/pfynwald.html) and Salgesch, infrastructure of running projects was used to examine the effect of drought and understory removal, respectively. In Novaggio, tea bags were incubated in summer and winter to study the effect of seasonality particularly precipitation. Tea bags are collected after 3, 12, 24, and 36 months; for the two time-shifted experiments additionally after 6 and 9 months. The study has two primary objectives. Firstly, it contributes to TeaComposition initiative (http://teacomposition.org/) which aims at investigating long-term litter decomposition and its key drivers at present as well as under different future climate scenarios using a common protocol and standard litter (tea) across nine terrestrial biomes. Secondly, the data are used to further develop decomposition models such as Yasso (http://en.ilmatieteenlaitos.fi/yasso) which is used by several countries, including Switzerland to estimate the annual carbon fluxes in dead wood, litter, and soil for reporting in National Greenhouse Gas Inventories under the United Nations Framework Convention on Climate Change and the Kyoto Protocol.12 years ago
- The dataset Hydro-CH2018 reservoirs provides estimates of current and future water supply, water demand, and storage volumes for 307 medium-sized catchments in Switzerland. Water supply for current (1981-2010) and future (2070-2099) climate conditions was simulated using the hydrological model PREVAH. For modeling current water supply, observed meteorological time series were used as input, while simulated meteorological time series derived from 39 model chains of the CH2018 initiative were used as an input for simulating future climate conditions. Water demand was estimated for six categories: - 1) Drinking water (households and tourism), - 2) industry (second and third sector), - 3) artificial snow production, - 4) agriculture (irrigation and livestock feeding), - 5) ecology (residual flows), and - 6) hydropower. Future estimates consider changes in demand related to population growth and changes in the hydrological conditions. Storage volumes are provided for natural lakes (storage capacities and usable volumes), artificial reservoirs, reservoirs for artificial snow production, and drinking reservoirs. A detailed description of the simulation and estimation procedures can be found in * Brunner, M.I., Björnsen Gurung, A., Zappa, M., Zekollari, H., Farinotti, D., Stähli, M., 2019. Present and future water scarcity in Switzerland: Potential for alleviation through reservoirs and lakes. Sci. Total Environ. 666, 1033–1047. https://doi.org/10.1016/j.scitotenv.2019.02.169. This dataset contains the following information: 1. Shapefile with the 307 medium-sized Swiss catchments. 2. Textfiles with the water supply simulations for the control run and the 39 climate model chains (one file per chain) at daily resolution for the 307 catchments. 3. Textfiles with the current and future demand estimates per category at monthly resolution for the 307 catchments. 4. Textfiles with the storage volumes per category and catchment.52 years ago
- This dataset contains all data, on which the following publication below is based. **Paper Citation**: Neff, F., Korner-Nievergelt, F., Rey, E., Albrecht, M., Bollmann, K., Cahenzli, F., Chittaro, Y., Gossner, M. M., Martínez-Núñez, C., Meier, E. S., Monnerat, C., Moretti, M., Roth, T., Herzog, F., Knop, E. 2022. Different roles of concurring climate and regional land-use changes in past 40 years' insect trends. Nature Communications, DOI: [10.1038/s41467-022-35223-3](https://doi.org/10.1038/s41467-022-35223-3) Please cite this paper together with the citation for the datafile. Please also refer to this publication for details on the methods. ## Summary Mean annual occupancy estimates for 390 insect species (215 butterflies [Papilionoidea, incl. Zygaenidae moths], 103 grasshoppers [Orthoptera], 72 dragonflies [Odonata]) for nine bioclimatic zones in Switzerland. Covers the years 1970-2020 (for butterflies) and 1980-2020 (for grasshoppers and dragonflies). Mean occupancy denotes the average number of 1 km x 1 km squares in a zone occupied by the focal species. Occupancy estimates stem from occupancy-detection models run with species records data hosted and curated by [info fauna](http://www.infofauna.ch). Data on the level of single MCMC iterations of model fitting are included (4000 sampling iterations). The nine bioclimatic zones were defined based on biogeographic regions and two elevation classes (square above or below 1000 m. asl)12 years ago
- This dataset contains all data on which the following publication below is based. __Paper Citation:__ > Risch AC, Ochoa-Hueso R, van der Putten WH, Bump JK, Busse MD, Frey B, Gwiazdowicz DJ, Page-Dumroese DS, Vandegehuchte ML, Zimmermann S, Schütz M. Size-dependent loss of aboveground animals differentially affects grassland ecosystem coupling and functions. 2018. Nature Communications 9: 3684. [doi: 10.1038/s41467-018-06105-4](https://doi.org/10.1038/s41467-018-06105-4). Please cite this paper together with the citation for the datafile. #Methods ##Study sites The experimental exclosure setups were installed within the SNP (IUCN category Ia preserve; Dudley 2008), in south-eastern Switzerland. The park covers 172 km2 of forests and subalpine and alpine grasslands along with scattered rock outcrops and scree slopes. The entire area has been protected from human impact (no hunting, fishing, camping or off-trail hiking) since 1914. Large, fairly homogenous patches of short- and tall-grass vegetation, which originate from different historical management and grazing regimes, cover the park’s subalpine grasslands entirely. Short-grass vegetation developed in areas where cattle used to rest (nutrient input) prior to the park’s foundation (14th century to 1914) (Schütz and others 2003, 2006) and is dominated by lawn grass species such as Festuca rubra L., Briza media L. and Agrostis capillaris L. (Schütz and others 2003, 2006). Today, this vegetation type is intensively grazed by diverse vertebrate and invertebrate communities that inhabit the park and consume up to 60% of the available biomass (Risch and others 2013). Tall-grass vegetation developed where cattle formerly grazed, but did not rest, and is dominated by rather nutrient-poor tussocks of Carex sempervirens Vill. and Nardus stricta L. (Schütz and others 2003, 2006). This vegetation type receives considerably less grazing, with only roughly 20% of the biomass consumed (Risch and others 2013). Consequently, the two vegetation types together represent a long-term trajectory of changes in grazing regimes. Underlying bedrock of all grasslands is dolomite, which renders these grasslands rather poor in nutrients regardless of former and current land-use regimes. ##Experimental design To progressively exclude aboveground vertebrate and invertebrate animals, we established 18 size-selective exclosure setups (nine in short-grass, nine in tall-grass vegetation) distributed over six subalpine grasslands across the SNP (Risch and others 2013, 2015). Elevation differences of exclosure locations did not exceed 350 m (between 1975 and 2300 m a.s.l.). The exclosures were established immediately after snowmelt in spring 2009 and were left in place for five consecutive growing seasons (until end of 2013). They were, however, temporarily dismantled every fall (late October after first snowfall) to protect them from avalanches. They were re-established in the same location every spring immediately after snowmelt. Each size-selective exclosure setup consisted of five plots (2 x 3 m) that progressively excluded aboveground vertebrates and invertebrates from large to small. The plots are labelled according to the guilds that had access to them “L/M/S/I”, “M/S/I”, “S/I”, “I”, “None”; L = large mammals, M = medium mammals, S = small mammals, I = invertebrates, None = no animals had access. As we only had permission to have the experimental setup in place for five consecutive growing seasons, the experiment had to be completely dismantled in the late fall of 2013 and all material removed from the SNP. Our exclosure design was aimed at excluding mammalian herbivores, but naturally also excluded the few medium and small mammalian predators, as well as the entire aboveground invertebrate food web. A total of 26 large to small mammal species can be found in the SNP, but large apex predators are missing (wolf, bear, lynx) . Reptiles, amphibians and birds are scarce to absent in the subalpine grasslands under study. Only two reptile species occur in the park and they are confined to rocky areas that warm up enough for them to survive. One frog species spawns in an isolated pond far from our grasslands. Only three bird species occasionally feed on the subalpine grasslands. Using game cameras (Moultrie 6MP Game Spy I-60 Infrared Digital Game Camera, Moultrie Feeders, Alabaster, AL, USA), we did observe that the medium- and small-sized mammals (marmot/hares and mice) were not afraid to enter the fences and feed on their designated plots. We never spotted reptiles, amphibians or birds on camera. We distinguished between 59 higher aboveground-dwelling invertebrate taxa that our size-selective exclosures excluded (see also methods for aboveground-dwelling invertebrates below). The “L/M/S/I” plot (not fenced) was located at least 5 m from the 2.1 m tall and 7 x 9 m large main electrical fence that enclosed the other four plots. The bottom wire of this fence was mounted at 0.5 m height and was not electrified to enable safe access for medium and small mammals, while fencing out the large ones. Within each main fence, we randomly established four 2 x 3 m plots separated by 1-m wide walkways from one another and from the main fence line: 1) the “M/S/I” plots were unfenced, allowing access to all but the large mammals; 2) the “S/I” plots (10 x 10 cm electrical mesh fence) excluded all medium-sized mammals. Note that the bottom 10 cm of this fence remained non-electrified to enable safe access for small mammals; 3) the “I” plots (2 x 2 cm metal mesh fence) excluded all mammals. We double-folded the mesh at the bottom 50 cm to reduce the mesh size to smaller than 1 x 1 cm openings; and 4) the “None” plots were surrounded by a 1 m tall mosquito net (1.5 x 2 mm) to exclude all animals. The top of the plot was covered with a mosquito-meshed wooden frame mounted to the corner posts (roof). We treated these plots a few times with biocompatible insecticide (Clean kill original, Eco Belle GmbH, Waldshut-Tiengen, Germany) to remove insects that might have entered during data collection or that hatched from the soil, but amounts were negligible and did not impact soil moisture conditions within these plots. To assess whether the design of the “None” exclosure (mesh and roof) affected the response variables within the plots and, therefore, influenced the results, we established an additional six “micro-climate control” exclosures (one in each of the six grasslands) (Risch and others 2013, 2015). These exclosures were built as the “None” exclosures but were open at the bottom (20 cm) of the 3-m side of the fence facing away from the prevailing wind direction to allow invertebrates to enter. A 20-cm high and 3-m long strip of metal mesh was used to block access to small mammals. Thus, this construction allowed a comparable micro-climate to the “None” plots, but also a comparable feeding pressure by invertebrates to the “I” plots. We compared various properties within these exclosures against one another to assess if our construction altered the conditions in the “None” plots. We showed that differences in plant (e.g., vegetation height, aboveground biomass) and soil properties (e.g., soil temperature, moisture) found between the “I” and the “None” treatments were not due to the construction of the “None” exclosure, but a function of animal exclusions, although the amount of UV light reaching the plant canopy was significantly reduced (Risch and others 2013). ##Aboveground invertebrate sampling Aboveground invertebrates were sampled with two different methods to capture both ground- and plant-dwelling organisms: 1) we randomly placed two pitfall traps (67 mm in diameter, covered with a roof) filled with 20% propylene glycol in one 1 x 1 m subplot of the 2 x 3 m treatment plots in spring 2013 (May) and emptied them every two weeks until late September 2013 (Vandegehuchte and others 2017b, 2018). A pitfall trap consisted of a plastic cylinder (13 cm depth, 6.75 cm diameter). Within each cylinder we placed a 100 ml plastic vial with outer diameter 6.70 cm and on top of the cylinder we placed a plastic funnel to guide the invertebrates into the vials. Each trap was cover with a cone-shaped and transparent plastic roof to protect the trap from rain (Vandegehuchte and others 2017b, 2018). Note that in the “None” plots only one trap was placed as control to check for effectiveness of the exclosure. 2) We vacuumed all invertebrates from a 60 x 60 cm area on another 1 x 1 m subplot with a suction sampler (Vortis, Burkhard manufacturing CO, Ltd., Rickmansworth, Hertfordshire, UK) every month from June to September 2013 (Vandegehuchte and others 2017b, 2018). For this purpose, we quickly placed a square plastic frame (60 x 60 x 40 cm) with a closable mosquito mesh sleeve attached to the top edge into the plot from the outside. The suction sample was then inserted into through the sleeve and operated for 45 s to collect the invertebrates (Vandegehuchte and others 2017b, 2018). We sorted the ≈100 000 individuals collected with both methods by hand and identified each individual morphologically to the lowest taxonomic level feasible (59 taxa, including orders, suborders, subfamilies, families; phylum for Mollusca). These taxa belonged to the following feeding types: 19 herbivores, 16 detritivores, 9 predators, 8 mixed feeders, 5 omnivores and 2 non-classified feeders (or not feeding as adults) (Vandegehuchte and others 2017b). We summed the numbers from the two pitfall traps and the suction sampling over the course of the 2013 season to represent the aboveground invertebrate abundance and community composition of a plot. Note: we did not specifically attempt to catch flying invertebrates with e.g., sticky traps, thus a few flying insects may have been missed with our vacuum sampling approach. ##Sampling of plant properties The vascular plant species composition was assessed at peak biomass every summer (July) by estimating the frequency of occurrence of each species with the pin count method in each plot (Frank and McNaughton 1990). A total of 172 taxa occurred within our 90 plots and we calculated plant species richness for each plot separately. We used the 2013 data in this study. Plant quality was assessed every year in July and September; here we use plant quality at the end of the experiment (September 2013). Two 10 x 100 cm wide strips of vegetation per plot were clipped, combined, dried at 65°C, and ground (Pulverisette 16, Fritsch, Idar-Oberstein, Germany) to pass through a 0.5 mm sieve. Twenty randomly selected samples across all treatments were analysed for N (Leco TruSpec Analyser, Leco, St. Joseph, Michigan, USA) (Vandegehuchte and others 2015). Nitrogen concentrations of the other samples were then estimated from models established for the experiment and the entire SNP relating Fourier transform-near infrared reflectance (FT-NIR) spectra to the measured values of N using a multi-purpose FT-NIR spectrometer (Bruker Optics, Fällanden, Switzerland) (Vandegehuchte and others 2015). Root biomass was sampled every fall by collecting five 2.2 cm diameter x 10 cm deep soil samples (Giddings Machine Company, Windsor, CO, USA) per plot (450 samples year-1). The samples were dried at 30 °C and roots were sorted from the sample by hand. We sorted each sample for 1 h which allowed to retrieve over 90% of all roots present in the samples (Risch and others 2013). The roots were then dried at 65 °C for 48 and weighed to the nearest mg. We averaged the values per plot and used the 2013 data only in this study. ##Sampling of edaphic communities In 2009, 2010, and 2011 we collected three composited soil samples (5 cm diameter x 10 cm depth; AMS Samplers, American Falls, ID, USA) and assessed bacterial community structure using T-RFLP profiling (Liu and others 1997; Blackwood and others 2003; Hodel and others 2014). We detected a total of 89 operational taxonomic units (OTUs). These values are in accordance with other studies reporting OTU richness (Wirthner and others 2011; Zumsteg and others 2012; Meola and others 2014) using T-RFLP profiling, a method that detects the most abundant, and thus likely, the most relevant, taxa. We averaged the data over the three years of collections for our calculations. Microbial biomass carbon (MBC) was determined with the substrate-induced method (Anderson and Domsch 1978) every fall (September) between 2009 and 2013 by collecting three mineral soil samples (5 cm diameter × 10 cm mineral soil core, AMS Samplers, American Falls, ID, USA). The three samples were combined (90 samples for each sampling year), immediately put on ice, taken to the laboratory, passed through a 2-mm sieve and stored at 4°C. Again, we only used the 2013 data in this study. Soil samples (5 cm diameter x 10 cm depth) to extract soil arthropods were collected in June, July, and August 2011 with a soil corer lined with a plastic sleeve to ensure an undisturbed sample (total of 270 samples). The plastic line core was immediately sealed on both ends using cling film and put into a cooler. All plots were sampled within three days and the extraction of arthropods started the evening of the sampling day using a high-gradient Tullgren funnel apparatus (Crossley and Blair 1991; Vandegehuchte and others 2015). Samples were kept in the extractor for four days and the soil arthropods were collected in 95% ethanol. All individuals were counted and each individual was identified morphologically to the lowest level feasible [76 taxa, including orders, suborders, subfamilies, families (Protura, Thysanoptera, Aphidina, Psylina, Coleoptera, Brachycera, Nematocera, Auchenorryncha, Heteroptera, Formicidae); sub-phylum for Myriapoda, for Acari and Collembola also including morpho-species). Note that we also included larval stages (nine of the 76 taxa) (Vandegehuchte and others 2015). All data were summed over the season. A detailed species list for mites and collembolans is published (Vandegehuchte and others 2017a) [https://doi.org/10.1371/journal.pone.0118679.s001]. Earthworms are rare in the SNP and therefore were not included. We collected eight random 2.2 cm diameter x 10 cm deep soil cores from each plot in September 2013 to determine the soil nematode community composition. The samples were mixed and the nematodes were extracted from 100 ml of fresh soil using Oostenbrink elutriators (Oostenbrink 1960). All nematodes in a 1 ml of the 10 ml extract were counted, a minimum of 150 individuals sample-1 were identified to genus or family level using (Bongers 1988), the numbers of all nematodes were extrapolated to the entire sample and expressed for a 100 g dry sample. In total we identified 63 genus or family levels (Vandegehuchte and others 2015). The list of all the nematodes found is published (Vandegehuchte and others 2015) [http://www.oikosjournal.org/appendix/oik-03341] or DOI: [doi: 10.1111/oik.03341]. We are aware that sampling soil microbes from 2009 to 2011 and soil arthropods in 2011 was not ideal, but we are positive that this does not bias the results. Most of the parameters measured in our experiment either already showed a treatment response after the first growing season (e.g., plant biomass) or did not respond over the entire time experiment (e.g., microbial biomass C). The microbial community composition (2009 – 2011) was highly influenced by inter-annual differences in temperature and precipitation, but did not differ between treatments or vegetation types (Hodel and others 2014). We therefore felt comfortable using the 2009 through 2011 data for describing the soil microbial community in our experimental treatments. Similarly, we are positive that our soil arthropod data are representative. We did assess soil arthropods in August 2012 and found no differences to the August 2011 data. However, we did not feel comfortable combining the 2011 June, July, August data with only August data for 2012 for our analyses. ##Sampling of soil properties We collected three soil samples (5 cm diameter x 10 cm depth) in each plot in September 2013 after removing the vegetation. First, we collected the top layer of mineral soil rich in organic matter, the surface organic layer or rhizosphere, typically 1 to 3 cm in depth with a soil corer (AMS Samples, American Falls, Idaho, USA). Second, we collected a 10 cm mineral soil core beneath this surface layer. The cores for each layer were composited, dried at 65 °C for 48 h and fine-ground to pass a 0.5 mm screen. We then analysed all samples for total C using a Leco TruSpec Analyser (Leco, St. Joseph, Michigan, USA). Mineral soil pH was measured potentiometrically in 1:2 soil:CaCl2 solution with an equilibration time of 30 min. Soil net N mineralisation was assessed during the 2013 growing season (Risch and others 2015). For this purpose, we randomly collected a 5 cm diameter x10 cm deep soil sample with a soil corer (AMS Samples, American Falls, Idaho, USA) after clipping the vegetation in June 2013. After weighing and sieving (4 mm mesh) the soil, we extracted a 20 g subsample in 1 mol l-1 KCl for 1.5 h on an end-over-end shaker and thereafter filtered it through ashless folded filter paper (DF 5895 150, ALBET LabScience, Hahnenmühle FineArt GmbH, Dassel, Germany). From these filtrates NO3- concentrations were measured colorimetrically (Norman and Stucki 1981) and NH4+with flow injection analysis (FIAS 300, Perkin Elmer, Waltham Massachusetts, USA) (Risch and others 2015). We dried the rest of the sample 105 °C to constant mass to determine fine,fraction bulk density. A second soil sample was collected within each plot in June 2013 with a corer lined with a 5 x 13 cm aluminium cylinder. The corer was driven 11.5 cm deep into the soil so that the top 1.5 cm of the cylinder remained empty. Into this space we placed a polyester bag (250 µm) filled an ion-exchanger resin to capture the incoming N. The bag was filled with a 1:1 mixture of acidic and alkaline exchanger resin (ion-exchanger I KA/ion exchanger IIIAA, Merck AG, Darmstadt, Germany). We then removed 1.5 cm soil at the bottom of the cylinder and placed a second resin exchanger bag into this space to capture the N leached from the soil column. To assure that the exchange resin was saturated with H+ and Cl- prior to filling the bags, the mixture was stirred with 1.2 ml l-1 HCl for 1 h and then rinsed with demineralized water until the electrical conductivity of the water reached 5 µm cm-1. The cylinder with the resin bags in place was reinserted into the soil with the top flush to the soil surface and incubated for three months. We recollected the cylinders in September 2013. Each resin bag and 20 g of sieved soil (4 mm mesh) from each cylinder were then separately extracted with KCl and NO3- and NH4+ concentrations were measured. Nitrate and NH4+ concentrations of all samples were then converted to a content basis by multiplying their values with fine fraction bulk density. Net N mineralisation was thereafter calculated as the difference between the N content of the samples collected at the end of the three-month incubation (including the N extracted from the bottom resin bag) and the N content at the beginning of the incubation (Risch and others 2015). Soil CO2 emissions were measured every two weeks between 0900 and 1700 hrs from early May through late September 2013 with a PP-Systems SRC-1 soil respiration chamber (15 cm high, 10 cm diameter; closed circuit) attached to a PP-Systems EGM-4 infrared gas analyser (PP-Systems, Amesbury, MA, USA) on two locations per plot (Risch and others 2013). The chamber was placed on randomly placed, permanently installed PVC collars (10 cm diameter) driven 5 cm into the soil at the beginning of the study (Risch and others 2013). Freshly germinated plants growing within the collars were removed prior to each measurement to avoid measuring plant respiration or photosynthesis. The two measurements collected per plot and sampling date were averaged. Soil moisture (with time domain reflectometry; Field-Scout TDR-100, Spectrum Technologies, Plainfield, Illionois, USA) and temperature (with a waterproof digital pocket thermometer; Barnstead International, Dubuque, Iowa, USA) were measured at five random locations per plot every two weeks during the growing seasons during the experiment for the 0 to 10 cm depth (Risch and others 2013, 2015). As soil moisture and soil temperature were highly negatively correlated (Risch and others 2013), we only used soil moisture for this study. We used plot-level averages of all values available to capture soil moisture variability during the five years of the experiment. The results remained unchanged when we only used soil moisture from the 2013 growing season. ##Numeral calculations and statistical analyses Ecosystem coupling. We conducted principal component analyses (PCAs; unscaled) at the complete dataset level using the abundances of each taxonomical entity to describe each of the five different communities used in this study: aboveground-dwelling invertebrates, vascular plants, soil microorganisms, soil arthropods and soil nematodes. We retained the first two components (PCA axis 1 and PCA axis 2) of each analysis as we found them to adequately represent the temporal and spatial variability of our 90 treatment plots in previous studies55,67. Together they explained a total of 71.70% of the variation for aboveground invertebrates, 44.36% for plants, 44.85% for soil microorganisms, 61.85% for soil arthropods and 77.19% for soil nematodes. In addition, we used soil pH and soil organic C content as a proxy for soil chemical properties, soil bulk density as a proxy for soil physical properties and soil moisture (negatively correlated with soil temperature) as a proxy for soil micro-climatic conditions for an overall total of fourteen constituents. We calculated ecosystem coupling9 for each exclosure treatment within each vegetation type (i.e., 2 5 treatment combinations in total) as an integrated measure of pairwise ecological interactions between ecosystem constituents representing ecological communities and the soil abiotic environment. These ecological interactions are defined by non-parametric Spearman rank correlation analyses between two constituents, excluding interactions involving two abiotic constituents (e.g., soil pH vs. soil moisture) and interactions between the first (PC1) and second (PC2) component of each community type, as these are orthogonal by definition. Interactions between abiotic constituents were excluded from the analyses because the focus of our study was on communities and how they interact with one another and their surrounding environment; therefore, including abiotic-abiotic interactions was not of interest here. Given that the effectiveness of our experimental design resulted in that no community composition data of aboveground-dwelling invertebrates was available for the “None” plots (all animals excluded), only thirteen instead of fourteen constituents were included in the ecosystem coupling calculations for this treatment. The complete absence of aboveground invertebrates represents the most extreme case of disturbance between aboveground animal communities and the rest of the ecosystem constituents. This may have resulted in a slight overestimation of ecosystem coupling for these plots. Average ecosystem coupling was calculated as follows: Ecosystem coupling= where Xi is the absolute Coupling was calculated value of the Spearman’s rho coefficient of the ith correlation for each treatment within each vegetation type (i.e., based on nine replicates each), considering and n is the number of pairwise comparisons considered (n = a total of 80; interactions (56 in the case of the “None” treatment). We considered a total of 40 biotic-biotic interactions (i.e., concerning two community-level principal components such as plants and microbes; 24 in the case of the “None” treatment) and 40 abiotic-biotic (i.e., concerning one community-level principal component and one abiotic factor, e.g., plant community and soil properties; 32 in the case of the “None” treatment). Coupling was calculated for each treatment within each vegetation type (i.e., based on nine replicates each), considering a total of 80 interactions (56 in the case of the “None” treatment). We considered a total of 40 biotic-biotic interactions (i.e., concerning two community-level principal components such as plants and microbes; 24 in the case of the “None” treatment) and 40 abiotic-biotic (i.e., concerning one community-level principal component and one abiotic factor, e.g., plant community and soil properties; 32 in the case of the “None” treatment). To establish whether constituents were significantly and positively coupled within treatments (i.e., the average of their correlation coefficients were greater than in a null model where correlation only happens by chance), we calculated one-tailed p-values based on permutation tests with 999 permutations. We considered six ecosystem functions and process rates commonly used to assess ecosystem functioning (Meyer and others 2015; Manning and others 2018). Plant N content represents a measure of forage quality, while plant richness has been shown to stabilise biomass production, thus allowing the system to respond to changes in herbivory. Soil net N mineralisation, soil respiration, root biomass, and microbial biomass represent fluxes or stocks of energy. For all functions and processes higher values represent higher functioning (Manning and others 2018). All these variables were measured in the last year of the experiment (2013). We then quantified ecosystem multifunctionality using the multiple threshold approach (Byrnes and others 2014; Manning and others 2018), which considers the number of functions that are above a certain threshold, over a series of threshold values (typically 10-99%) that are defined based on the maximum value of each function. We weighted all our functions equally for these calculations (Manning and others 2018). The number of functions in a plot with values higher than a given threshold value for the respective function is summed up. The sum represents ecosystem multifunctionality for that plot. Given that choosing any particular threshold as a measure of ecosystem multifunctionality is arbitrary, we calculated the average of thresholds from 10-90% (in 10% intervals) as a more integrated representation of ecosystem multifunctionality. We used Pearson correlations to explore the relationships between ecosystem coupling (all interactions, biotic-biotic interactions, abiotic-biotic interactions involving above- and belowground constituents, and all interactions, biotic-biotic interactions, abiotic-biotic interactions involving belowground constituents only) and ecosystem multifunctionality by calculating the slopes of all relationships between ecosystem coupling and multifunctionality for all thresholds between 10 and 99%. We also related ecosystem coupling with the average of multifunctionality at thresholds between 30-80% as explained before and considered this correlation as a robust indication of the type of association between these two variables. In addition, we explored the relationships between ecosystem coupling (all interactions, biotic-biotic interactions, abiotic-biotic interactions involving above- and belowground constituents, and all interactions, biotic-biotic interactions, abiotic-biotic interactions involving belowground constituents only) and individual ecosystem functions. The effects of exclosures and vegetation type on individual functions and multifunctionality were evaluated using linear mixed effects models ('lme' function of the nlme package), with exclosure and vegetation type as fixed effects and fence as a random factor. All statistical analyses and numerical calculations were done in R version 3.4.0 (R Core Team 2016). #References - Anderson J, Domsch K. 1978. A physiological method for the quantitative measurement of microbial biomass in soil. Soil Biol Biochem 10:215–21. - Blackwood CB, Marsh T, Kim S-H, Paul EA. 2003. Terminal Restriction Fragment Length Polymorphism Data Analysis for Quantitative Comparison of Microbial Communities. Appl Environ Microbiol 69:926–32. http://www.ncbi.nlm.nih.gov/pmc/articles/PMC143601/ - Bongers T. 1988. De nematoden von Nederland. Schoorl, The Netherlands: Pirola - Byrnes JEK, Gamfeldt L, Isbell F, Lefcheck JS, Griffin JN, Hector A, Cardinale BJ, Hooper DU, Dee LE, Duffy JE. 2014. Investigating the relationship between biodiversity and ecosystem multifunctionality: Challenges and solutions. Methods Ecol Evol 5:111–24. - Crossley DAJ, Blair JM. 1991. A high-efficiency low-technology Tulgren-type extractor for soil microarthopods. Agric Ecosyst Environ 34:187–92. - Dudley N. 2008. Guidelines for applying protected area managment categories. Gland: IUCN - Frank DA, McNaughton SJ. 1990. Aboveground biomass estimation with the canopy intercept method: A plant growth form caveat. Oikos 57:57–60. - Haynes AG, Schütz M, Buchmann N, Page-Dumroese DS, Busse MD, Risch AC. 2014. Linkages between grazing history and herbivore exclusion on decomposition rates in mineral soils of subalpine grasslands. Plant Soil 374. - Hodel M, Schütz M, Vandegehuchte ML, Frey B, Albrecht M, Busse MD, Risch AC. 2014. Does the aboveground herbivore assemblage influence soil bacterial community composition and richness in subalpine grasslands? Microb Ecol 68:584–95. - Liu WT, Marsh TL, Cheng H, Forney LJ. 1997. Characterization of microbial diversity by determining terminal restriction fragment length polymorphisms of genes encoding 16S rRNA. Appl Environ Microbiol 63:4516–22. http://www.ncbi.nlm.nih.gov/pmc/articles/PMC168770/ - Manning P, van der Plas F, Soliveres S, Allan E, Maestre FT, Mace G, Whittingham MJ, Fischer M. 2018. Redefining ecosystem multifunctionality. Nat Ecol Evol 2:427–36. https://doi.org/10.1038/s41559-017-0461-7 - Meola M, Lazzaro A, Zeyer J. 2014. Diversity, resistance and resilience of the bacterial communities at two alpine glacier forefields after a reciprocal soil transplantation. Environ Microbiol 16:1918–34. https://onlinelibrary.wiley.com/doi/abs/10.1111/1462-2920.12435 - Meyer ST, Koch C, Weisser WW. 2015. Towards a standardized Rapid Ecosystem Function Assessment (REFA). Trends Ecol Evol 30:390–7. http://www.sciencedirect.com/science/article/pii/S0169534715000968 - Norman R., Stucki JW. 1981. The determination of nitrate and nitrite in soil extracts by ultraviolet spectrophotometry. Soil Sci Soc Am J 45:347–53. - Ochoa-Hueso R. 2016. Non-linear disruption of ecological interactions in response to nitrogen deposition. Ecology 87:2802–2814. - Oostenbrink M. 1960. Estimating nematode populations by some selected methods. In: Sasser NJ, Jenkins WR, editors. Nematology. Chapel Hill, NC, USA: University of North Carolina Press. pp 85–101. - R Core Team. 2016. R: A language and environment for statistical computing. Vienna, Austria: R Foundation for Statistical Computing - Risch AC, Haynes AG, Busse MD, Filli F, Schütz M. 2013. The response of soil CO2 fluxes to progressively excluding vertebrate and invertebrate herbivores depends on ecosystem type. Ecosystems 16:1192–202. - Risch AC, Schütz M, Vandegehuchte ML, Van Der Putten WH, Duyts H, Raschein U, Gwiazdowicz DJ, Busse MD, Page-Dumroese DS, Zimmermann S. 2015. Aboveground vertebrate and invertebrate herbivore impact on net N mineralization in subalpine grasslands. Ecology 96:3312–22. - Schütz M, Risch AC, Achermann G, Thiel-Egenter C, Page-Dumroese DS, Jurgensen MF, Edwards PJ. 2006. Phosphorus translocation by red deer on a subalpine grassland in the Central European Alps. Ecosystems 9:624–633. - Schütz M, Risch AC, Leuzinger E, Krüsi BO, Achermann G. 2003. Impact of herbivory by red deer (Cervus elaphus L.) on patterns and processes in subalpine grasslands in the Swiss National Park. For Ecol Manage 181:177–88. - Vandegehuchte ML, van der Putten WH, Duyts H, Schütz M, Risch AC. 2017a. Aboveground mammal and invertebrate exclusions cause consistent changes in soil food webs of two subalpine grassland types, but mechanisms are system-specific. Oikos 126:212–23. - Vandegehuchte ML, Raschein U, Schütz M, Gwiazdowicz DJ, Risch AC. 2015. Indirect short- and long-term effects of aboveground invertebrate and vertebrate herbivores on soil microarthropod communities. PLoS One 10:e0118679. - Vandegehuchte ML, Schütz M, de Schaetzen F, Risch AC. 2017b. Mammal-induced trophic cascades in invertebrate food webs are modulated by grazing intensity in subalpine grassland. J Anim Ecol 86:1434–46. - Vandegehuchte ML, Trivellone V, Schütz M, Firn J, de Schaetzen F, Risch AC. 2018. Mammalian herbivores affect leafhoppers associated with specific plant functional types at different timescales. Funct Ecol 32:545–55. - Wirthner S, Frey B, Busse MD, Schütz M, Risch AC. 2011. Effects of wild boar (Sus scrofa L.) rooting on the bacterial community structure in mixed-hardwood forest soils in Switzerland. Eur J Soil Biol 47:296–302. http://dx.doi.org/10.1016/j.ejsobi.2011.07.003 - Zumsteg A, Luster J, Göransson H, Smittenberg RH, Brunner I, Bernasconi SM, Zeyer J, Frey B. 2012. Bacterial, Archaeal and Fungal Succession in the Forefield of a Receding Glacier. Microb Ecol 63:552–64. https://doi.org/10.1007/s00248-011-9991-812 years ago
- # Background information The availability of nitrogen (N) and phosphorus (P) is considered to be a major factor limiting growth and productivity in terrestrial ecosystems globally. This project aimed to determine whether the growth stimulation documented in previous short‐term fertilisation trials persisted in a longer‐term study (12 years) in the treeline ecotone, and whether possible negative effects of nutrient addition offset the benefits of any growth stimulation. Over the course of the 12 study years, NPK fertiliser corresponding to 15 or 30 kg N ha−1 a−1 was added annually to plots containing 30‐year‐old *Larix decidua* or 32‐year-old *Pinus uncinata* individuals with an understorey of mainly ericaceous dwarf shrubs. To quantify growth, annual shoot increments of trees and dwarf shrubs as well as radial growth increments of trees were measured. Nutrient concentrations in the soil were also measured and the foliar nutritional status of trees and dwarf shrubs was assessed. # Experimental design Over an elevation gradient of 140 m across the treeline afforestation site Stillberg, 22 locations were chosen that covered the whole range of microenvironmental conditions (*see* Nutrient addition experimental design.png). Half of the blocks included European larch (*L. decidua*) and the other half included mountain pine (*P. uncinata*). Within each block, three plantation quadrats were randomly selected as experimental plots and each plot was assigned to a control (no fertilisation) or to one of two fertiliser dose treatments (15 kg and 30 kg N ha−1 a−1). Treatments were assigned randomly but confined so that the location of fertilised plots within a block was not directly above control plots to avoid nutrient input from drainage. For details about the experiment, *see* Möhl et al (2019). # Data description The available datasets contain climate variables (2004-2016), nutrient isotope measurements (2010 & 2016), shrub growth measurements (2004-2016), soil parameter measurements and annual ring and shoot measurements (2004-2016). All data can be found here:32 years ago
- High quality meteorological data are needed for long-term forest ecosystem research, particularly in the light of global change. The long-term data series published here comprises almost 20 years of measurements for one meteorological station in Alpthal in Switzerland which is located within a natural coniferous forest (ALB) with Norway spruce (_Picea abies_; 180-230 yrs) as dominant tree species. The meteorological time series are presented in hourly time resolution of air temperature, relative humidity, precipitation, photosynthetically active radiation (PAR) and wind speed. Alpthal is part of the Long-term Forest Ecosystem Research Programme (LWF) established and maintained by the Swiss Federal Research Institute WSL.32 years ago
- Validation points, validation area, ground truth coverage, SPOT 6 avalanche outlines, Sentinel-1 avalanche outlines, Sentinel-2 avalanche outlines, Davos avalanche mapping (DAvalMap) avalanche outlines as shapefiles and a detailed attribute description (DataDescription_EvalSatMappingMethods.pdf). Coordinate system: CH1903+_LV95 The generation of this dataset is described in detail in: Hafner, E. D., Techel, F., Leinss, S., and Bühler, Y.: Mapping avalanches with satellites – evaluation of performance and completeness, The Cryosphere, https://doi.org/10.5194/tc-2020-272, 2021.12 years ago
- Foliage has been sampled every two years since 1995/1997 on 5-6 trees of the main species on all LWF plots. Concentrations of macronutrients (N, P, K, Ca, Mg, S), carbon (C) and micronutrients are determined on leaves and current and previous year needles. The dry mass of 100 leaves or 1000 needles is determined as well. ### Purpose: ### To assess the nutrient status of the forest stands and detect possible deficiencies or imbalances, which are often indicative of processes at the ecosystem level. ### Manual Citation: ### * Brang, P., Hug, C., Thimonier, A., Zehnder, U., 1997. Kapitel D1.5 Nährstoffversorgung von Nadeln und Blättern, in: Brang, P. (Ed.), Aufnahmeanleitungen aller Forschungsprojekte auf Flächen der Langfristigen Waldökosystem-Forschung (LWF). Eidg. Forschungsanstalt WSL, Birmensdorf, pp. 1-12. * Rautio P, Fürst A, Stefan K, Raitio H, Bartels U, 2016: Part XII: Sampling and Analysis of Needles and Leaves. In: UNECE ICP Forests Programme Co-ordinating Centre (ed.): Manual on methods and criteria for harmonized sampling, assessment, monitoring and analysis of the effects of air pollution on forests. Thünen Institute of Forest Ecosystems, Eberswalde, Germany, 19 p. + Annex [http://icp-forests.net/page/icp-forests-manual](http://icp-forests.net/page/icp-forests-manual) ### Paper Citation: ### * Thimonier A, Graf Pannatier E, Schmitt M, Waldner P, Walthert L, Schleppi P, Dobbertin M, Kräuchi N (2010) Does exceeding the critical loads for nitrogen alter nitrate leaching, the nutrient status of trees and their crown condition at Swiss Long-term Forest Ecosystem Research (LWF) sites?. European Journal of Forest Research, 129 (3): 443-461. [doi: 10.1007/s10342-009-0328-9](http://doi.org/10.1007/s10342-009-0328-9)12 years ago
- The dataset comprises > 90 000 records from inventories in 54 strict forest reserves in [Switzerland](https://www.wsl.ch/de/wald/biodiversitaet-naturschutz-urwald/naturwaldreservate.html) and [Lower Saxony / Germany](http://naturwaelder.de/) along a considerable environmental gradient. It was used to develop parsimonious, species-specific mortality models for 18 European tree species based on tree size and growth as well as additional covariates on stand structure and climate. ## Inventory data Measurements had been conducted repeatedly on up to 14 permanent plots per reserve for up to 60 years with re-measurement intervals of 4 - 27 years. The permanent plots vary in size between 0.03 and 3.47 ha. The inventories provide diameter measurements at breast height (DBH) and information on the species and status (alive or dead) of trees with DBH ≥ 4 cm for Switzerland and ≥ 7 cm for Germany. ## Data selection We excluded three permanent plots where at least 80 % of the trees died during an interval of 10 years, and mortality could be clearly assigned to a disturbance agent. Mortality in the remaining stands was rather low, with a mean annual mortality rate of 1.5 % and strong variation between plots from 0 to 6.5 % (assessed for trees of all species with DBH ≥ 7 cm). We only used data from permanent plots with at least 20 trees per species to obtain reliable plot-level mortality rates even for species with low mortality rates (about 5 % during 10 years), and selected tree species occurring on at least 10 plots to cover sufficient ecological gradients. This led to a dataset of 197 permanent plots and 18 tree or shrub species: _Abies alba_ Mill., _Acer campestre_ L., _Acer pseudoplatanus_ L., _Alnus incana_ Moench., _Betula pendula_ Roth, _Carpinus betulus_ L., _Cornus mas_ L., _Corylus avellana_ L., _Fagus sylvatica_ L., _Fraxinus excelsior_ L., _Picea abies_ (L.) Karst, _Pinus mugo_ Turra, _Pinus sylvestris_ L., _Quercus pubescens_ Willd., _Quercus_ spp. (_Q. petraea_ Liebl. and _Q. robur_ L.; not properly differentiated in the Swiss inventories), _Sorbus aria_ Crantz, _Tilia cordata_ Mill. and _Ulmus glabra_ Huds.. ## Predictors of tree mortality We considered tree size and growth as key indicators for mortality risk. Radial stem growth between the first and second inventory and DBH at the second inventory were used to predict tree status (alive or dead) at the third inventory. To this end, the annual relative basal area increment (relBAI) was calculated as the compound annual growth rate of the trees basal area. Additional covariates on stand structure and climate comprise mean annual precipitation sum (P), mean annual air temperature (mT), the mean and the interquartile range of DBH (mDBH, iqrDBH), basal area (BA) and the number of trees (N) per hectare. ## Further information For further information, refer to Hülsmann _et al_. (in press) How to kill a tree – Empirical mortality models for eighteen species and their performance in a dynamic forest model. _Ecological Applications_.12 years ago
- 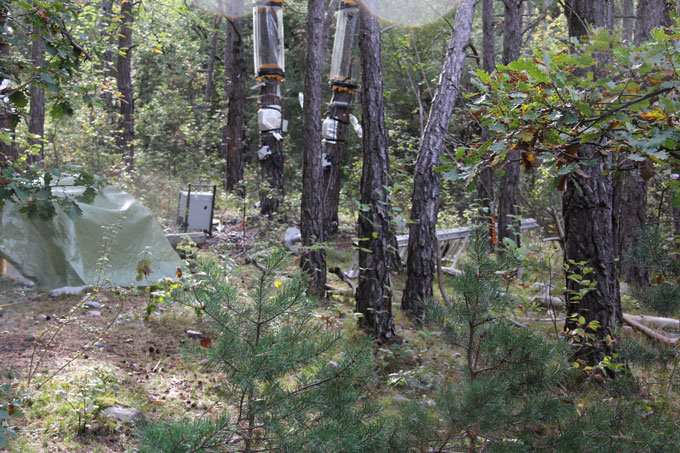 As the largest contiguous pine forest in Switzerland, the Pfyn forest in Canton Valais (46° 18' N, 7° 36' E, 615 m ASL) offers the best conditions for such measurements. In light of this, a WSL research team installed a long-term experiment of 20 years duration in the Pfyn forest. The average temperature here is 9.2°C, the yearly accumulated precipitation is 657 mm (average 1961-1990). The pines in the middle of the forest are about 100 years old and 10.8 m high. The test area has 876 trees covering 1.2 ha divided into 8 plots of 1'000 m2 each. Between the months of April and October, four of these plots are irrigated by a sprinkler system providing an additional 700 mm of water, annually. In the other four plots, the trees grow under natural, hence relatively dry conditions.22 years ago
- Two surveys on the topic of data usage where conducted for the Global Cryosphere Watch data portal. The first one focused on the data provider point of view while the second one focused on the data user point of view. 37 data providers (ie institutions) worldwide provided their answers for the first survey (from fall 2017 until summer 2018) while 54 users (contacted through various mailing list such as the Cryolist) answered the questions on their third party data usage (fall 2019 until January 2020).22 years ago
- We conducted two drone flights with the Wingtra and DJI Phantom 4 RTK drones in Davos Wolfgang Arelen, on 25.08.2021. The data was processed with the Agisoft Metashape Professional Software.The Wingtra point cloud was further processed to derive a ground classification in individual LASTools and Terrasolid workflows.12 years ago
- The present dataset is the summary of each planning intention (name, type, development pattern, land use, and link with governance and supra regionel conditions), the explanation of interest, and the mapping from plan.12 years ago
- __DISCLAIMER__: CORE is still in development. Interested parties are warmly invited to join common development, to comment, discuss, find bugs, etc. __Acknowledgement:__ The CORE format was proudly inspired by the Cloud Optimized GeoTIFF ([COG](https://www.cogeo.org/)) format, by considering how to leverage the ability of clients issuing HTTP GET range requests for a time-series of remote sensing and aerial imagery (instead of just one image). __License:__ The Cloud Optimized Raster Encoding (CORE) specifications are released to the public domain under a Creative Commons 1.0 CC0 "No Rights Reserved" international license. You can reuse the information contained herein in any way you want, for any purposes and without restrictions. ----------------------- __Summary:__ The Cloud Optimized Raster Encoding (CORE) format is being developed for the efficient storage and management of gridded data by applying video encoding algorithms. It is mainly designed for the exchange and preservation of large time series data in environmental data repositories, while in the same time enabling more efficient workflows on the cloud. It can be applied to any large number of similar (in pixel size and image dimensions) raster data layers. CORE is not designed to replace COG but to work together with COG for a collection of many layers (e.g. by offering a fast preview of layers when switching between layers of a time series). __WARNING__: Currently only applicable to RGB/Byte imagery. The final CORE specifications may probably be very different from what is written herein or CORE may not ever become productive due to a myriad of reasons (see also 'Major issues to be solved'). With this early public sharing of the format we explicitly support the Open Science agenda, which implies __"shifting from the standard practices of publishing research results in scientific publications towards sharing and using all available knowledge at an earlier stage in the research process"__ (quote from: European Commission, Directorate General for Research and Innovation, 2016. Open innovation, open science, open to the world). __CORE Specifications:__ 1) a MP4 or WebM video digital multimedia container format (or any future video container playable as HTML video in major browsers) 2) a free to use or open video compression codec such as H.264, VP9, or AV1 (or any future video codec that is open sourced or free to use for end users) Note: H.264 is currently recommended because of the wide usage with support in all major browsers, fast encoding due to acceleration in hardware (which is currently not the case for AV1 or VP9) and the fact that MPEG LA has allowed the free use for streaming video that is free to the end users. However, please note that H.264 is restricted by patents and its use in proprietary or commercial software requires the payment of royalties to [MPEG LA](https://www.mpegla.com/programs/avc-h-264/). However, when AV1 matures and accelerated hardware encoding becomes available, AV1 is expected to offer 30% to 50% smaller file size in comparison with H.264, while retaining the [same quality](https://trac.ffmpeg.org/wiki/Encode/AV1). 3) the encoding frame rate should be of one frame per second (fps) with each layer segmented in internal tiles, similar to COG, ordered by the main use case when accessing the data: either layer contiguous or tile contiguous; Note: The internal tile arrangement should support an easy navigation inside the CORE video format, depending on the use case. 4) a CORE file is optimised for streaming with the moov atom at the beginning of the file (e.g. with -movflags faststart) and optional additional optimisations depending on the codec used (e.g. -tune fastdecode -tune zerolatency for H.264) 5) metadata tags inside the moov atom for describing and using geographic image data (that are preferably compatible with the [OGC GeoTIFF standard](https://www.ogc.org/standards/geotiff) or any future standard accepted by the geospatial community) as well as list of original file names corresponding to each CORE layer 6) it needs to encode similar source rasters (such as time series of rasters with the same extent and resolution, or different tiles of the same product; each input raster should be having the same image and pixel size) 7) it provides a mechanism for addressing and requesting overviews (lower resolution data) for a fast display in web browser depending on the map scale (currently external overviews) __Major issues to be solved:__ - Internal overviews (similar to COG), by chaining lower resolution videos in the same MP4 container for fast access to overviews first); Currently, overviews are kept as separate files, as external overviews. - Metadata encoding (how to best encode spatial extent, layer names, and so on, for each of the layer inside the series, which may have a different geographical extent, etc...; Known issues: adding too many tags with FFmpeg which are not part of the standard MP4 moov atom; metadata tags have a limited string length. - Applicability beyond RGB/Byte datasets; defining a standard way of converting cell values from Int16/UInt16/UInt32/Int32/Float32/Float64/ data types into multi-band Byte values (and reconstructing them back to the original data type within acceptable thresholds) __Example__ __Notice__: The provided CORE (.mp4) examples contain modified Copernicus Sentinel data [2018-2021]. For generating the CORE examples provided, 50 original Sentinel 2 (S-2) TCI data images from an area located inside Switzerland were downloaded from www.copernicus.eu, and then transformed into CORE format using ffmpeg with H.264 encoding using the [x264 library](https://www.videolan.org/developers/x264.html). For full reproducibility, we provide the original data set and results, as well scripts for data encoding and extraction (see resources).42 years ago
- Dataset from the publication "L-Band Radiometry of Alpine Seasonal Snow Cover: 4 Years at the Davos-Laret Remote Sensing Field Laboratory", under review in IEEE JOURNAL OF SELECTED TOPICS IN APPLIED EARTH OBSERVATIONS AND REMOTE SENSING. volume and issue TBD. Dataset specifics are described in the publication.62 years ago
- Dataset of meteorological and snowpack measurements from the automatic weather station at Weissfluhjoch, Davos, Switzerland, suitable for driving snowpack models. The dataset contains standard meteorological measurements, and additionally snowpack runoff data from a snow lysimeter. Where possible, data is quality checked and missing data are replaced from backup sensors from the measurement site itself, or (in only a few cases) from the MeteoSwiss weather station at 470 m distance and 150 m above the measurement site. __Publication__ Wever, N., Schmid, L., Heilig, A., Eisen, O., Fierz, C., and Lehning, M. Verification of the multi-layer SNOWPACK model with different water transport schemes. 2015. The Cryosphere. Volume 9. 2271-2293. http://dx.doi.org/10.5194/tc-9-2271-2015.122 years ago
- These data on snow instability include three data subsets that were analyzed and the results published by Reuter and Schweizer (2018) who suggest a novel framework on how to describe snow instability by failure initiation, crack propagation and slab tensile support. Please refer to the Read-me file for further details on the data. These data are the basis of the following publication: Reuter, B. and Schweizer, J., 2018. Describing snow instability by failure initiation, crack propagation and slab tensile support. Geophys. Res. Lett., 45, doi: 10.1029/2018GL078069.22 years ago
- The dataset contains the electrical resistivity tomography (ERT) monitoring data from the publication Wicki and Hauck (2022). It contains the unprocessed monitoring data and the filtered monitoring data prior to the inversion process. The data is organized in two zip-files: * Napf_Raw_BIN.zip: Raw monitoring data in bin-format * Napf_Filtered_DAT.zip: Filtered monitoring data in dat-format including topography of the monitoring line The zip files contain the apparent resistivity measurements (ohm m) of the individual measurements. The naming convention of the files is according to following convention: site_profile_configuration_date_time.format The file names contain following abbreviations: * Site: Napf * Profile: Hor (horizontal profile), Ver (vertical profile) * Configuration: WS (Wenner-Schlumberger configuration) * Date: Format YYYY-MM-DD * Time: Format hhmm22 years ago
- The data are described in detail in the paper "Aerosol and dynamical contributions to cloud droplet formation in Arctic low-level clouds" (https://doi.org/10.5194/egusphere-2023-530, 2023). This dataset includes particle number size distribution data from two DMPSs, chemical composition data from a Tof-ACSM, updraft velocity from an ultrasonic anemometer and a wind lidar, cloud droplet number concentration from a HOLIMO and meteorological data (wind speed and direction, temperature). Note that aerosol composition from a filter pack system, organiccarbon massfrom a high volume sampler and eBC concentration from a MAAP are available on EBAS and therefore not included here72 years ago
- In 2000, a permanent forest plot of 10 ha has been established in the core zone of the primeval beech forest of Uholka. All living and dead trees with a diameter at breast height (DBH) ≥ 60 mm were identified to species, DBH measured, stems tagged and mapped. Since then, the plot has been remeasured in 2005, 2010, and 2015. In total, 4,820 individual trees were measured with 14,116 individual measurements throughout all four inventories. In spring 2018, an Airborne Laser Scan was carried out, covering the Uholka‐Shyrokyi Luh forest. This data set allows us to derive a high‐resolution digital elevation model (DEM) of the plot area. The data set allows for important insights into the development and the spatial and temporal dynamics of primeval beech forests.22 years ago
- The present dataset is the summary of each planning intention (name, type, development pattern, land use, and link with governance and supra regionel conditions), the explanation of interest, and the mapping from plan.12 years ago
- The data presented here corresponds to the publication "A Close-Ridge Small-Scale Atmospheric Flow Field and its Influence on Snow Accumulation" (Gerber et al., 2017), which investigates an eddy-like structure in the vicinity of the Sattelhorn in the Dischma valley (Davos Switzerland) and its influence on snow accumulation. The dataset contains: * Alpine3D: Alpine3D snow depth grids (25 m resolution) for two simulations with and without snow redistribution. * ARPS: 10 ARPS simulations (25 m horizontal resolution) with different model setups (wind direction, wind speed, stability). * LiDAR: Processed LiDAR PPI (D2_PPI_1h) and RHI (D2_cross_1h) across the valley with a hourly resolution for the period 27 October 2015 01:00 - 29 October 2015c 21:00 (spatial resolution: 25 m). * meteostations-dischma: Meteorological station data of two meteorological stations in the Dischma valley with 10 minute resolution for the period 28 October 2015 - 30 October 2015. * TLS: Snow depth change data (m) between 28 October 2015 and 30 October 2015 based on terrestrial laser scans. For more details about the simulation and observation data, see Gerber et al., 2017. __Publication__: Gerber et al., 2017: A Close-Ridge Small-Scale Atmospheric Flow Field and its Influence on Snow Accumulation, submitted to JGR - Atmospheres.12 years ago
- Tree circumference change measurements from plastic girth bands ### Purpose: ### Assessment of annual tree stem growth ### Manual Citation: ### * Dobbertin M, Neumann M, 2016: Part V: Tree Growth. In: UNECE ICP Forests, Programme Co-ordinating Centre (ed.): Manual on methods and criteria for harmonized sampling, assessment, monitoring and analysis of the effects of air pollution on forests. Thünen Institute of Forest Ecosystems, Eberswalde, Germany, 17 p. + Annex [http://icp-forests.net/page/icp-forests-manual](http://icp-forests.net/page/icp-forests-manual) ### Paper Citation: ### * Etzold S, Waldner P, Thimonier A, Schmitt M, Dobbertin M (2014) Tree growth in Swiss forests between 1995 and 2010 in relation to climate and stand conditions: Recent disturbances matter. Forest Ecology and Management, 311: 41-55. [doi: 10.1016/j.foreco.2013.05.040](http://doi.org/10.1016/j.foreco.2013.05.040)12 years ago
- __Dataset description__ This dataset is a recalculation of the Copernicus 2015 high resolution layer (HRL) of imperviousness density data (IMD) at different spatial/territorial scales for the case studies of Barcelona and Milan. The selected spatial/territorial scales are the following: * a) Barcelona city boundaries * b) Barcelona metropolitan area, Àrea Metropolitana de Barcelona (AMB) * c) Barcelona greater city (Urban Atlas) * d) Barcelona functional urban area (Urban Atlas) * e) Milan city boundaries * f) Milan metropolitan area, Piano Intercomunale Milanese (PIM) * g) Milan greater city (Urban Atlas) * h) Milan functional urban area (Urban Atlas) In each of the spatial/territorial scales listed above, the number of 20x20mt cells corresponding to each of the 101 values of imperviousness (0-100% soil sealing: 0% means fully non-sealed area; 100% means fully sealed area) is provided, as well as the converted measure into squared kilometres (km2). __Dataset composition__ The dataset is provided in .csv format and is composed of: _IMD15_BCN_MI_Sources.csv_: Information on data sources _IMD15_BCN.csv_: This file refers to the 2015 high resolution layer of imperviousness density (IMD) for the selected territorial/spatial scales in Barcelona: * a) Barcelona city boundaries (label: bcn_city) * b) Barcelona metropolitan area, Àrea metropolitana de Barcelona (AMB) (label: bcn_amb) * c) Barcelona greater city (Urban Atlas) (label: bcn_grc) * d) Barcelona functional urban area (Urban Atlas) (label: bcn_fua) _IMD15_MI.csv_: This file refers to the 2015 high resolution layer of imperviousness density (IMD) for the selected territorial/spatial scales in Milan: * e) Milan city boundaries (label: mi_city) * f) Milan metropolitan area, Piano intercomunale milanese (PIM) (label: mi_pim) * g) Milan greater city (Urban Atlas) (label: mi_grc) * h) Milan functional urban area (Urban Atlas) (label: mi_fua) _IMD15_BCN_MI.mpk_: the shareable project in Esri ArcGIS format including the HRL IMD data in raster format for each of the territorial boundaries as specified in letter a)-h). Regarding the territorial scale as per letter f), the list of municipalities included in the Milan metropolitan area in 2016 was provided to me in 2016 from a person working at the PIM. In the IMD15_BCN.csv and IMD15_MI.csv, the following columns are included: * Level: the territorial level as defined above (a)-d) for Barcelona and e)-h) for Milan); * Value: the 101 values of imperviousness density expressed as a percentage of soil sealing (0-100%: 0% means fully non-sealed area; 100% means fully sealed area); * Count: the number of 20x20mt cells corresponding to a certain percentage of soil sealing or imperviousness; * Km2: the conversion of the 20x20mt cells into squared kilometres (km2) to facilitate the use of the dataset. __Further information on the Dataset__ This dataset is the result of a combination between different databases of different types and that have been downloaded from different sources. Below, I describe the main steps in data management that resulted in the production of the dataset in an Esri ArcGIS (ArcMap, Version 10.7) project. 1. The high resolution layer (HRL) of the imperviousness density data (IMD) for 2015 has been downloaded from the official website of Copernicus. At the time of producing the dataset (April/May 2021), the 2018 version of the IMD HRL database was not yet validated, so the 2015 version was chosen instead. The type of this dataset is raster. 2. For both Barcelona and Milan, shapefiles of their administrative boundaries have been downloaded from official sources, i.e. the ISTAT (Italian National Statistical Institute) and the ICGC (Catalan Institute for Cartography and Geology). These files have been reprojected to match the IMD HRL projection, i.e. ETRS 1989 LAEA. 3. Urban Atlas (UA) boundaries for the Greater Cities (GRC) and Functional Urban Areas (FUA) of Barcelona and Milan have been checked and reconstructed in Esri ArcGIS from the administrative boundaries files by using a Eurostat correspondence table. This is because at the time of the dataset creation (April/May 2021), the 2018 Urban Atlas shapefiles for these two cities were not fully updated or validated on the Copernicus Urban Atlas website. Therefore, I had to re-create the GRC and FUA boundaries by using the Eurostat correspondence table as an alternative (but still official) data source. The use of the Eurostat correspondence table with the codes and names of municipalities was also useful to detect discrepancies, basically stemming from changes in municipality names and codes and that created inconsistent spatial features. When detected, these discrepancies have been checked with the ISTAT and ICGC offices in charge of producing Urban Atlas data before the final GRC and FUA boundaries were defined. Steps 2) and 3) were the most time consuming, because they required other tools to be used in Esri ArcGIS, like spatial joins and geoprocessing tools for shapefiles (in particular dissolve and area re-calculator in editing sessions) for each of the spatial/territorial scales as indicated in letters a)-h). Once the databases for both Barcelona and Milan as described in points 2) and 3) were ready (uploaded in Esri ArcGIS, reprojected and their correctness checked), they have been ‘crossed’ (i.e. clipped) with the IMD HRL as described in point 1) and a specific raster for each territorial level has been calculated. The procedure in Esri ArcGIS was the following: * Clipping: Arctoolbox > Data management tools > Raster > Raster Processing > Clip. The ‘input’ file is the HRL IMD raster file as described in point 1) and the ‘output’ file is each of the spatial/territorial files. The option "Use Input Features for Clipping Geometry (optional)” was selected for each of the clipping. * Delete and create raster attribute table: Once the clipping has been done, the raster has to be recalculated first through Arctoolbox > Data management tools > Raster > Raster properties > Delete Raster Attribute Table and then through Arctoolbox > Data management tools > Raster > Raster properties > Build Raster Attribute Table; the "overwrite" option has been selected. Other tools used for the raster files in Esri ArcGIS have been the spatial analyst tools (in particular, Zonal > Zonal Statistics). As an additional check, the colour scheme of each of the newly created raster for each of the spatial/territorial attributes as per letters a)-h) above has been changed to check the consistency of its overlay with the original HRL IMD file. However, a perfect match between the shapefiles as per letters a)-h) and the raster files could not be achieved since the raster files are composed of 20x20mt cells. The newly created attribute tables of each of the raster files have been exported and saved as .txt files. These .txt files have then been copied in the excel corresponding to the final published dataset.42 years ago
- The dataset contains the input and output files from the publication by Hirschberg et al. (2022). The input files are the climate forcing time series generated with the AWE-GEN model. The output files include the hydrological outputs, which is the same for scenarios 1-6 considered in Hirschberg et al. (2022), and the sediment-related outputs, whereas the transport-limited scenario 6 is included in the output of scenario 1. The input file includes: - time _D_ (h) - precipitation _Pr_ (mm/h) - atmospheric temperature _Ta_ (°C) - incoming shortwave radiation _Rsw_ (W/m^2) - cloudiness _N_ (-) The output files include: - hydrological outputs (accroding to time in input and normalized by basin area) - total discharge _Q_ (mm/h) - surface discharge _Qs_ (mm/h) - subsurface discharge _Qss_ (mm/h) - soil water storage _Vw_ (mm) - snow depth _snow_ (mm SWE) - snow depth change _snowacc_ (mm/h SWE) - potential evapotranspiration _PET_ (mm/h) - actual evapotranspiration _AET_ (mm/h) - sediment outputs (accroding to time in input and normalized by basin area) - hillslope landslide magnitude _ls_ (mm/h) - channel sediment storage _sc_ (mm) - hillslope sediment storage _sh_ (mm) - total sediment discharge _so_ (mm/h) - transport-limited total sediment discharge _sopot_ (mm/h) - sediment discharge by debris flows _dfs_ (mm/h) - transport-limited sediment discharge by debris flows _dfspot_12 years ago
- Volume of stemwood at least 7 cm in diameter (limit for coarse wood) without the bark and stump that were living trees or shrubs starting at 12 cm dbh in the pre-inventory and were cut between two inventories. __Citation:__ > _Abegg, M.; Brändli, U.-B.; Cioldi, F.; Fischer, C.; Herold-Bonardi, A.; Huber M.; Keller, M.; Meile, R.; Rösler, E.; Speich, S.; Traub, B.; Vidondo, B. (2014). Fourth national forest inventory - result tables and maps on the Internet for the NFI 2009-2013 (NFI4b). [Published online 06.11.2014] Available from World Wide Web http://www.lfi.ch/resultate/ Birmensdorf, Swiss Federal Research Institute WSL. [doi:10.21258/1057112](https://doi.org/10.21258/1057112)_22 years ago
- Dataset collected from dendroecological study on trunks of grapevines ('Chardonnay' cv.) infected by the "Flavescence dorée" phytoplasma (FDp) in Origlio (southern Switzerland) in 2019-2020. Ring widths were measured with cellSens (Olympus Corporation). Calculations and analysis were conducted within R. The Flavescence dorée phytoplasma (FDp) causes a severe grapevine (Vitis vinifera) disease. Anatomical modification due to FDp infections are known to occur but research so far focused on stems and leaf tissues and, in particular, on their phloem structure. In this paper, we applied dendrochronological techniques on wood rings and analysed the anatomical structures of the trunk of the susceptible grapevine cultivar ‘Chardonnay’ in order to verify their response to FDp infections. In this study, we tested the impact of FDp and drought stress on xylem ring width and also described phloem anomalies inside the trunk of grapevines. We concluded that drought and FDp infection both have a significant effect on ring width reductions and that FDp supersedes the effect of drought conditions (calculated after the SPEI index) in infected specimens.22 years ago
- Carabid beetle and wild bee occurrences in the city of Zurich, Switzerland. Dataset available upon request (An agreement between the data provider and the data recipient is necessary).22 years ago
- Hillshade of the digital surface model (DSM), calculated from digital aerial stereo images. The image data was acquired by the Federal Office of Topography swisstopo. The resolution of the DSM is 1 m x 1 m.22 years ago
- The available datasets are snow depth maps with a spatial resolution of 2m generated from image matching of ADS 80/100 data. Image acquisition took place at peak of winter (time when the thickest snowpack is expected). The snow depth maps are the difference of a summer DSM from the winter DSM of the corresponding date . The summer DSM used is a product of image matching of ADS 80 data from summer 2013. In the available products buildings, vegetation and outliers were masked (set to NoData). For the elimination of buildings the TLM layer (swisstopo) was used, because this layer might not represent exactly the state of infrastructure at time of image acquisition, it is possible that mainly in dense settlement some buildings were not successfully masked. For the relevant area above treeline the masking of buildings showed good results. Vegetation got masked for a height above ground > 1m and was detected in a combination of summer and winter data sets. As Outliers were considered unrealistic snow depths caused by a failure of the image matching algorithm. Snow depths > 15m and smaller than < -15m were classified as outliers. Negative snow depth were kept, because of an uncertainty in image orientation accuracy. It is expected that in regions with negative snow depth also positive snow depth are underestimated by the same amount, which means that an estimation of snow volume should be carried out summing up the absolute values of snow depth (also the negative ones). For volume estimation in small regions the user has to take into account, that orientation accuracy of the images is roughly around 1-2 GSD (30cm), which propagates directly to the snow depth product. Areas which are not covered by snow got assigned a value of 0 as snow depth. The work is published in: Bühler, Y.; Marty, M.; Egli, L.; Veitinger, J.; Jonas, T.; Thee, P.; Ginzler, C., (2015). Snow depth mapping in high-alpine catchments using digital photogrammetry. Cryosphere, 9 (1), 229-243. doi: 10.5194/tc-9-229-201592 years ago
- This data set includes 589 snow profile observations including a rutschblock test, observations of signs of instability and an assessment of the local avalanche danger level, mainly recorded in the region of Davos (eastern Swiss Alps) during the winter seasons 2001-2002 to 2018-2019. These data were analyzed and results published by Schweizer et al. (2021). They characterized the avalanche danger levels based on signs of instability (whumpfs, shooting cracks, recent avalanches), snow stability class and new snow height. The data are provided in a csv file (589 records); the variables are described in the corresponding read-me file. These data are the basis of the following publication: Schweizer, J., Mitterer, C., Reuter, B., and Techel, F.: Avalanche danger level characteristics from field observations of snow instability, Cryosphere, 15, 3293-3315, https://doi.org/10.5194/tc-15-3293-2021, 2021. ### Acknowlegements Many of the data were recorded by SLF observers and staff members, among those Roland Meister, Stephan Harvey, Lukas Dürr, Marcia Phillips, Christine Pielmeier and Thomas Stucki. Their contribution is gratefully acknowledged.22 years ago
- Model code and documentation for the downscaling model TopoCLIM which provides methods to downscale climate timeseries from CORDEX RCM data. This scheme specifically addresses the need for hillslope scale atmospheric forcing timeseries for modeling the local impact of regional climate change projections on the land surface in complex terrain. The method has a global scope and is able to generate the full suite of model forcing variables required for hydrological and land surface modeling at hourly timesteps. A working example is provided in this code archive but for full running of the scheme TopoSCALE is required https://doi.org/10.5194/gmd-7-387-2014 with code available at https://github.com/joelfiddes/tscaleV2. Standard library dependencies are given in the python requirements.txt of the archive with installation instructions in the README.md. License GPL v.322 years ago
- Data are compiled that have been used to demonstrate the impact of high water partial pressure on X-ray absorption spectra of ice.32 years ago
- After a major dieback of Scots pines in the Valais, an inner Alpine valley in Switzerland, the colonization of differently vigorous pines by stem and branch insects was investigated to assess their role in tree mortality. At 2 locations, the needle loss (defoliation) of some 500 pine trees was assessed twice a year. Of these trees, 34-36 trees were cut each year between 2001-2005 across all defoliation classes. From each tree, two 75-cm bolts were cut from both the stem and thick branches. They were incubated in photo-eclectors (metal cabinets) set up in a greenhouse where the insects could develop under the bark. The emerged adults were collected in water-filled eclector boxes and identified to species level by specialists. Attack time was estimated from the development time of each insect species emerged. The colonisation densities of the trees were related to the transparency level of each host tree at the time of attack.12 years ago
- The files correspond to the data and R-script used for the analyses of the following paper "Feasting on the ordinary or starving for the exceptional: phenological synchrony between spongy moth and budburst of European trees in a warmer climate" published in Ecology and Evolution by Vitasse et al. 2023. There are three zip files corresponding to the Temperature data, phenology/preference/performance tests and R-Scripts for the analyses. Input data: 'Synchrony_Cuttings_Pheno.txt':32 years ago
- This is a technical documentation of the procedure to run the Weather Research and Forecasting (WRF) model over complex alpine terrain using Consortium for Small-Scale Modeling (COSMO) reanalysis by the Federal Office of Meteorology and Climatology (MeteoSwiss) as initial and boundary conditions (COMSO-WRF). The setup is adapted for very high resolution simulations based on COSMO-2 (2.2 km resolution) reanalysis. This document gives an overview over steps to setup COSMO-WRF and adaptations needed to run COSMO-WRF. Additionally, the calculation of precipitation rate at a horizontal plane and remapping COSMO-WRF output on Swiss coordinates are documented.72 years ago
- Seasonal variation in environmental constraints (vapor pressure deficit – VPD, air temperature, and soil moisture) on tree growth for the potential distribution range of seven widespread Central European tree species. We simulated environmental constraints on growth fusing 3-PG model or the species’ potential distribution range within the forested area of Switzerland on a 1×1 km grid for seven dominant tree species: _Larix decidua_, _Picea abies_, _Abies alba_, _Fagus sylvatica_, _Acer pseudoplatanus_, _Pinus sylvestris_, and _Quercus robur_. For this purpose, we simulated the growth of these tree species in monocultures with the average climate observed during 1961–1990 or 1991-2018. The stands were initialized as 2-year-old plantations with an initial density of 2,500 trees ha-1 and simulated until the age of 30 years. For each simulated month, we obtained the relative contribution of environmental constraints (VPD, temperature, and soil water) on tree growth.12 years ago
- We conducted consecutive loading-relaxation experiments at low strain rates to study the viscoplastic behavior of the intact ice matrix in snow. The experiments were conducted using a micro-compression stage within the X-ray tomography scanner in the SLF cold laboratory. Next, to evaluate the experiments, a novel, implicit solution of a transient scalar model was developed to estimate the stress exponent and time scales in the effective creep relation (Glen's law). The result reveals that, for the first time, a transition in the exponent in Glen's law depends on geometrical grain size. A cross-over of stress exponent $n=1.9$ for fine grains to $n=4.4$ for coarse grains is interpreted as a transition from grain boundary sliding to dislocation creep. The dataset includes compression force data from 11 experiments and corresponding 3D image data from tomography scans.22 years ago
- Despite the common role of above- and below-ground herbivore communities in mediating ecosystem functioning, our understanding of the variation of species communities along natural gradient is largely strongly biased toward aboveground organisms. This dataset enables to study the variations in assemblages of two dominant groups of herbivores, namely, aboveground orthoptera and belowground nematodes together with their food plants. Herbivores and plant surveys were conducted in 48 natural grasslands along six elevation gradients, selected to span the major macro-climatic and environmental conditions of the Swiss Alps. It compiles herbivores and plant surveys, information on the study sites as well as plant and herbivores functional traits sought to be involved in trophic interactions and to respond to climatic variation along the elevation. Plant functional traits considered are the SLA, the LDMC, the C/N content, the punch strength (i.e. force required to pierce the leave lamina), the mandibular strength for Orthoptera insect. Data were collected during the summer 2016 and 2017.62 years ago
- The article "EnviDat Supports Open Science" originally appeared in WSLintern No. 3 (2020), page 14-15 and it is republished here with permission from the WSLintern editorial team. It contains guidelines for WSL scientists about the main issues behind Open Science and how to pragmatically approach the complexities of doing Open Science with EnviDat’s support. License: This article is released by WSL and the EnviDat team to the public domain under a Creative Commons 4.0 CC0 "No Rights Reserved" international license. You can reuse the information contained herein in any way you want, for any purposes and without restrictions.12 years ago
- The data supports the paper "Local and landscape factors shape alpha and beta trophic interaction diversity in urban gardens". It provides (1) the host-natural enemy interaction networks and network metrics between cavity-nesting bees and wasps and their natural enemies, and (2) the explanatory variables reflecting urban intensity, temperature, habitat amount and management intensity. The data is part of the BetterGardens project. It was sampled in 85 allotment and home gardens in the ctiy of Zurich in 2015 using standardized trapnests.12 years ago
- Five full-scale field tests were conducted with concrete blocks weighting between 800 and 3200 kg being dropped onto the roof of a gallery structure made from reinforced concrete. The impacts were recorded using high-speed video and acceleration measurements at the falling blocks. The dataset contains the raw data as well as the analyses of the block trajectories, i.e. kinetics and dynamics. Setup of the measurements and the analyses conducted are published in Volkwein, A. "Durchführung und Auswertung von Steinschlagversuchen auf eine Stahlbetongalerie", WSL-Berichte, Heft 68, 2018.32 years ago
- The WFJ_ICE_LAYERS dataset contains multi-instrument snowpack measurements at high temporal resolution, which enable to monitor the formation of deep ice layers due to preferential water flow, at the Weissfluhjoch research site, Davos, Switzerland. It covers the winter 2016/2017, with a focus on the early melting season. This dataset includes traditional snowpack profiles (weekly resolution, 15/11/2016-29/05/2017), SnowMicroPen penetration resistance profiles (daily resolution, 01/02/2017-19/04/2017), snow temperatures measured at different heights in the snowpack (half-hourly resolution, 01/03/2017-15/04/2017) and the water front height derived from an upward-looking ground penetrating radar (3-hour resolution, 04/03/2017-08/04/2017). The measurements are complemented by initialization files for SNOWPACK model simulations with the ice reservoir parameterization at Weissfluhjoch for the winter 2016/2017.22 years ago
- All plots classified as shrub forest according to the NFI forest definition. __Citation:__ > _Abegg, M.; Brändli, U.-B.; Cioldi, F.; Fischer, C.; Herold-Bonardi, A.; Huber M.; Keller, M.; Meile, R.; Rösler, E.; Speich, S.; Traub, B.; Vidondo, B. (2014). Fourth national forest inventory - result tables and maps on the Internet for the NFI 2009-2013 (NFI4b). [Published online 06.11.2014] Available from World Wide Web http://www.lfi.ch/resultate/ Birmensdorf, Swiss Federal Research Institute WSL. [doi:10.21258/1057112](https://doi.org/10.21258/1057112)_22 years ago
- Volume of stemwood with bark of living trees and shrubs (standing and lying) starting at 12 cm dbh. This corresponds internationally to the "growing stock". The correction for bias with the sample Tarif trees may be so drastic that it results in negative values with small numbers of trees. __Citation:__ > _Abegg, M.; Brändli, U.-B.; Cioldi, F.; Fischer, C.; Herold-Bonardi, A.; Huber M.; Keller, M.; Meile, R.; Rösler, E.; Speich, S.; Traub, B.; Vidondo, B. (2014). Fourth national forest inventory - result tables and maps on the Internet for the NFI 2009-2013 (NFI4b). [Published online 06.11.2014] Available from World Wide Web http://www.lfi.ch/resultate/ Birmensdorf, Swiss Federal Research Institute WSL. [doi:10.21258/1057112](https://doi.org/10.21258/1057112)_42 years ago
- The specific surface area (SSA) of different snow types were measured with the IceCube instrument and the Scanco Medical microCT 40. In addition, the snow particles created during the preparation of IceCube samples were counted. The difference in SSA between these instruments is explained by the formation of the surface particles. A numerical simulation using TARTES simulation support the observations.82 years ago
- High-resolution information on climatic conditions is essential to many applications in environmental and ecological sciences. Here we present the CHELSA (Climatologies at high resolution for the earth’s land surface areas) data of downscaled temperature and precipitation to a high resolution of 30 arc sec. The temperature algorithm is based on statistical downscaling of atmospheric temperatures. The precipitation algorithm incorporates orographic predictors including wind fields, valley exposition, and boundary layer height, with a subsequent bias correction. CHELSA data published in EnviDat includes the deprecated version 1.2 (originally published under 10.5061/dryad.kd1d4). Please use the current 2.1 version. __Paper Citation:__ > _Karger DN. et al. Climatologies at high resolution for the earth’s land surface areas, Scientific Data, 4, 170122 (2017) [doi: 10.1038/sdata.2017.122](https://doi.org/10.1038/sdata.2017.122)._32 years ago
- This dataset contains the raw environmental DNA data associated with the publication *Environmental drivers of eukaryotic plankton and fish biodiversity in an Arctic fjord* in the journal Polar Biology (2023). # Methods **Sampling** We sampled the Lilliehöök fjord on the west coast of Spitsbergen (Svalbard, Norway) over 3 days from 3 to 5 of August 2021. Samples were taken from the glacier front up to the fjord mouth of the Krossfjorden system, around 30 km long, after the Lilliehöök fjord merged with the mouth of Möller fjord. The fjord’s maximum depth has been recorded at 373 m (Svendsen et al. 2002) and has no sill at its entrance, thereby facilitating water exchange with the open ocean of the West Spitsbergen Current. We used a research vessel to sample 5 sites for a total of 15 samples, sampling 3 depths per site (3-m, chlorophyll a maximum and 85-m, unless sea floor was shallower). Shallow and intermediate samples between 3-m and 12-m represent ~35-L of water filtered in-situ using long tubing and a peristaltic pump, and all other deeper samples were taken from a total of 3 Niskin bottles (General Oceanics), representing 22-L of water sampled per sample. Water was filtered through a VigiDNA filtration capsule (SPYGEN) with a 0.20-µm pore size using an Athena peristaltic pump (Proactive Environmental Products, Bradenton, Florida) with a flow rate of ~1-L/min. Each sample was handled with single use tubing and gloves. **Molecular** To perform the amplification, we used two sets of primers: teleo (forward: ACACCGCCCGTCACTCT, reverse: CTTCCGGTACACTTACCATG; Valentini et al. 2016) and the universal eukaryotic 1389F/1510R primer pair, amplifying the V9-18S rDNA gene (Amaral-Zettler et al. 2009) (forward: TTGTACACACCGCCC, reverse: CCTTCYGCAGGTTCACCTAC). # Data content: + Metabarcoding data: This zip file contains the 2 sequencing libraries filtered to only retain the samples used in the present study. + Code, data and figure: This zip file contains all data and code to reproduce the figures and the analysis in the study, with an associated README explaining the content of each folder. # Additional informations For more details, please see the Methods in the associated publication: DOI: 10.1007/s00300-023-03187-9.22 years ago
- ## A spatial dataset and tool to simultaneously assess hydropower potential and ecological potential of the Swiss river network (Version 2016) ## Introduction The steadily growing demand for energy and the simultaneous pursuit of decarbonisation are increasing interest in the expansion of renewable energies worldwide. In Switzerland, various funding projects have been launched to promote technologies in the field of renewable energies and their application as quickly as possible. With the introduction of a funding instrument in 2009, the number of projects submitted to produce renewable energies increased rapidly. The applications for small hydropower plants (≤ 10 MW) were correspondingly numerous. However, the assessment of the environmental impact and its comparison with hydropower importance is still not standardized. To provide a basis for decision-making, a methodology was developed to determine the overall hydropower potential of a region. A detailed assessment of each river reach, and the systematic and holistic assessment of small hydropower projects at a regional scale are combined here. The assessment of a river reach is conducted at the river space (i.e., the river and adjacent areas) and at the surrounding landscape level. The HYDROpot_integral methodology was developed as part of Carol Hemund's dissertation (2012) at the University of Bern. It allows the evaluation of river reaches holistically, regarding ecological, social, economic and cultural criteria. As a second part of the overall project, the theoretical hydropower (or hydraulic) potential was calculated for the entire river network, which complemnets the spatial assessment. In particular, it is possible to classify river reaches into those that are more suitable for hydropower production (=”use”) and those that are more suitable for protection. ## Material and method The HYDROpot_Integral method was developed and tested on the basis of cantonal and national data (Hirschi et al. 2013). The method relies on 73 geodata sets. This holistic assessment is the key element of the entire assessment procedure. Its aim is to quantify the importance of the ecosystem functions in terms of services. The river network (GWN07) is divided into reaches of about 450m and for each reach two study units are defined. The river space (RS) records the ecosystem functions of the water body and the nearby riparian area. The length of the RS is 315 m on average in Switzerland and a maximum of 450 m, whereas the width is based on the FOEN definition (BWG 2001: 18f) and varies between 7-107 m. The surrounding landscape (SLS) is the second survey unit that records the ecosystem functions of the surrounding area over a range of 21 m to 321 m. The SLS is calculated over three times the RS width. The length of the SLS is identical to the length of the RS. The ecosystem functions are divided into three types: regulating (service A), cultural (service B) and provisioning (service C) functions. Accordingly, the assessment of the functions is divided into three parts and three values are assigned to each river reach. The more functions there are and the greater their performance, the higher these values are and the more important the corresponding functions are. Hence, these values quantify the importance of the ecosystem functions and the ecological, cultural and economic ecosystem services of each river reach. The concatenation of ecosystem services results in a value (ABC) that can occur in 125 different versions due to the chosen five-level value scale; i.e. each digit of the three-digit number sequence can be assigned a value between 1 and 5. Each of the 125 combinations, and thus each river reach, has its own characteristics determined by the assessments of the three function types. To record the suitability, the combinations are ranked according to their ecological, cultural and economic ecosystem services. These rules mean that the combination that is most suitable for hydropower production at minimum cost in terms of ecological and cultural ecosystem services and has a high economic potential is ranked first; rank 125 indicates the highest ecological and cultural ecosystem services and the lowest economic services and is therefore most suitable for protection. A river reach that is excluded from hydropower use due to legislation, a so-called priority reach, is given rank 126 from the outset and specially marked. A more detailed description of the methods can be found in Hirschi et al. 2013 [Link]. The dataset presented here presents the latest state of the HYDROpot_integral methodology applied at the national level. Only national data that is easily accessible was used in the preparation of the dataset. The cantonal data, such as renaturation and revitalization, would have to be requested by each canton individually and was excluded here. The nationwide value synthesis was made with R. A list of data sources can be found here [link to text file] A list of all parameters can be downloaded here [link to PDF and text files] ## Dataset description Data is presented as a single shapefile. It contains the river network and all assessment results obtained with HYDROpot_Integral. ## Changes in the methodology compared to the original method (Hirschi et. al 2013) * RS_A11 Ecomorphology: recorded for the whole of Switzerland and zero values equated with NA; individual cantons such as Zug and St. Gallen have no mapped values according to the modular concept of the federal government, Valais and Graubünden only the main valleys, Ticino and Fribourg not completely (BAFU 2009). * RS_A14 Renaturation and revitalization data: not centrally available at the time of data collection. centrally available, therefore values in GR were equated with NA. * RS_A15 Dilution ratio at wastewater treatment plants (WWTPs) for discharges: Zero values equal to NA. * RS_A20 Water flow: use WASTA (2013) with hydroelectric power plants (> 300 kW) under Federal control and dams serving hydroelectricity (Dam, as of 2013). * RS_C05 Synoptic hazard maps: are cantonally managed at the time of data collection, Values in GR are marked with a 5 so that the systematics in the decision tree is not affected. is affected. * Water quality (RS_A15, RS_A16, RS_A17, RS_A18, RS_A19): for the evaluation of the function type. A Nature, it is important whether the median of the five values is less than or equal to 3 in total. This evaluation is based on the decision tree for evaluating GR (Hirschi et al. 2013:22). Therefore, an evaluation of the station data is made where critical and possible river segments with poor quality (median less than 3) exist. Only two longer and one short sections in Switzerland receive a lower median than 3 for water quality. * SLS_B06 Visibility: For 99 percent of the river segments (30,733 of 31,062) in the canton of Bern (2015 reduced version), the landscape area is considered to be visible. Due to this high number of sections, a large number of viewpoints in the layer of Swisstopo and the computation time and computability in ArcGIS, the landscape area is classified as generally viewable (equal to 1). 16 Method Additional indicators were added (see Appendix B.2): * SLS_A21 Dissection * SLS_A22 Forest areas * SLS_B03 Hiking trails * SLS_B10 Residential and vacation homes * SLS_B11 Tourist infrastructure * SLS_C01 Landfill * SLS_C03 Infrastructure * SLS_C05 Industry * SLS_C06 Agricultural land Not to be added, although present to some extent: * SLS_B06 Cultural assets of national importance: here, too, the calculability of the visibility analysis is for the whole of Switzerland is limited * SLS_A15 Legally binding protection and land use planning: the individual river sections are not clearly designated, i.e. no geodata exist The following data are also not supplemented, as they are cantonal data: * SLS_A10 Cantonal nature reserves * SLS_A16 Forest reserves * SLS_A17 Cantonal inventories and contractually protected areas22 years ago
- We present newly digitized data on 6,929 plague outbreaks that occurred between 1347 and 1900 AD across Europe. The data base on an inventory initially published 1976. For georeferencing the information of Tele Atlas 2009 was used. The coordinates are in the reference systems ETRS89 and WGS84.12 years ago
- High quality meteorological data are needed for long-term forest ecosystem research, particularly in the light of global change. The long-term data series published here comprises almost 20 years of measurements for two meteorological stations in Beatenberg in Switzerland where one station is located within a natural coniferous forest (BAB) with Norway spruce (_Picea abies_; 190-210 yrs) as dominant tree species. A second station is situated in the very vicinity outside of the forest (field station, BAF). The meteorological time series are presented in hourly time resolution of air temperature, relative humidity, precipitation, photosynthetically active radiation (PAR) and wind speed. Beatenberg is part of the Long-term Forest Ecosystem Research Programme (LWF) established and maintained by the Swiss Federal Research Institute WSL.72 years ago
- The data set contained in this repository was used in the analysis by Mayer et al. (2023): Mayer, S. I., Techel, F., Schweizer, J., and van Herwijnen, A.: Prediction of natural dry-snow avalanche activity using physics-based snowpack simulations, EGUsphere, https://doi.org/10.5194/egusphere-2023-646, 2023.42 years ago
- Model code and documentation for the downscaling model TopoCLIM which provides methods to downscale climate timeseries from CORDEX RCM data. This scheme specifically addresses the need for hillslope scale atmospheric forcing timeseries for modeling the local impact of regional climate change projections on the land surface in complex terrain. The method has a global scope and is able to generate the full suite of model forcing variables required for hydrological and land surface modeling at hourly timesteps. A working example is provided in this code archive but for full running of the scheme TopoSCALE is required https://doi.org/10.5194/gmd-7-387-2014 with code available at https://github.com/joelfiddes/tscaleV2. Standard library dependencies are given in the python requirements.txt of the archive with installation instructions in the README.md.12 years ago
- Urbanization poses threats and opportunities for the biodiversity of wild bees. A main gap relates to the food preferences of wild bees in urban ecosystems, which usually harbour large numbers of plant species, particularly at the larval stage. This data sets describes the larval food of four wild bee species (i.e. Chelostoma florisomne, Hylaeus communis, Osmica bicornis and Osmia cornuta) and three genera (i.e. Chelostoma sp., Hylaeus sp, and Osmia sp.) common in urban areas in five different European cities (i.e. Antwerp, Paris, Poznan, Tartu and Zurich). This data results from a European-level study aimed at understanding the effects of urbanization on biodiversity across different cities and citiscapes, and a Swiss project aimed at understanding the effects of urban ecosystems in wild bee feeding behaviour. Wild bees were sampled using standardized trap-nests in 80 sites (32 in Zurich and 12 in each of the remaining cities), selected following a double gradient of available habitat at local and landscape scales. Larval pollen was obtained from the bee nests and identified using DNA metabarconding. The data provides the plant composition at the species or genus level of the different bee nests of the studied species in the studied sites of the five European cities. For Hylaeus communis, this is the first study in reporting larval food composition.22 years ago
- We conducted various drone flights at Grüenbödeli near Davos with the Sony RX1R II mounted on a Wingtra drone during 2020/21/22. The data was processed with the Agisoft Metashape Professional Software. The following products are available for download: - DSM 10cm resolution - Orthomosaic 3cm/25mm resolution - Snow Raster 10cm resolution - original RGB images12 years ago
- Geospatial vector data (shapefile) representing the cadastral plots in the Canton Ticino and the Moesa region (southern Switzerland) having a part of the surface occupied by vineyards in the years 1989 and/or 2020 according to the corresponding edition of the Swiss national topographic maps in the scale 1:25,000 and to the topographic landscape model of Switzerland swissTLM3D (Federal office of topography Swisstopo). In the attribute table there is many variables which describe the topography of the site, the characteristics of the plots and the evolution of the wine growing area inside the plot between 1989 and 2020. Coordinate system: EPSG:2056 - Swiss CH1903+ / LV95.12 years ago
- Table of Content: 1. General context of the data set "lsUDPs" ; 2. Background and aims of the study using the data set lsUDPs; 3. The data set lsUDPs: 3.1 Selection of cases and data collection; 3.2 Data management and operationalisation 1. General context of the data set "lsUDPs" The data set "lsUDPs" has been generated as part of the CONCUR research project (https://www.wsl.ch/en/projects/concur.html) led by Dr. Anna M. Hersperger and funded by the Swiss National Science Foundation (ERC TBS Consolidator Grant (ID: BSCGIO 157789) for the period 2016-2020. The CONCUR research project is interdisciplinary and aims to develop a scientific basis for adequately integrating spatial policies (in this case, strategic spatial plans) into quantitative land-change modelling approaches at the urban regional level. The first stage (2016-2017) of the CONCUR project focussed on 21 urban regions in Western Europe. The urban regions were selected through a multi-stage strategy for empirical research (see Hersperger, A. M., Grădinaru, S., Oliveira, E., Pagliarin, S., & Palka, G. (2019). Understanding strategic spatial planning to effectively guide development of urban regions. Cities, 94, 96–105. https://doi.org/10.1016/j.cities.2019.05.032 ). 2. Background and aims of the study using the data set lsUDPs As part of the CONCUR project, a specific task was to examine the relationship between strategic spatial plans and the formulation and implementation (i.e. urban land change) of large-scale urban development projects in Western Europe. Strategic urban projects are typically large-scale, prominent urban transformations implemented locally with the aim to stimulate urban growth, for instance in the form of urban renewals of deprived neighborhoods, waterfront renewals and transport infrastructures. While strategic urban projects are referred to in the literature with multiple terms, in the CONCOR project we call them large-scale urban development projects (lsUDPs). Previous studies acknowledged both local and supra-local (or structural) factors impacting the context-specific implementation of lsUDPs. Local governance factors, such as institutional capacity, coordination among public and private actors and political leadership, intertwine with supra-local conditions, such as state re-scaling processes and devolution of state competencies in spatial planning, de-industrialisation and increasing social inequality. Hence, in implementing lsUDPs, multi-scalar factors act in combination. Because the formulation and implementation of lsUDPs require multi-scalar coordination among coalitions of public and private actors over an extended period of time, they are generally linked to strategic spatial plans (SSPs). Strategic spatial plans convey collective visions and horizons of action negotiated among public and private actors at the local and/or regional level to steer future urban development, and can contain legally binding dispositions, but also indicative guidelines. The key question remains as to what extent large-scale urban development projects and strategic spatial plans can be regarded as aligned. By alignment, or “concordance”, we mean that strategic projects are formulated and implemented as part of the strategic planning process (“high concordance”), or that the strategic role of projects is reconfirmed in (subsequent) strategic plans (“moderate concordance”). Lack of concordance is found when lsUDPs have been limitedly (or not at all) acknowledged in strategic spatial plans. We assume that certain local and supra-local factors, characterising the development of the projects, foster (but not strictly “cause”) the degree of alignment between lsUPDs and SSPs. In this study, we empirically examine how, and to what extent, the concordance between 38 European large-scale urban development projects and strategic plans (outcome: CONCOR) has been enabled by five multi-scalar factors (or conditions): (i) the role of the national state (STATE), (ii) the role of (inter)national private actors (PRIVATE), (iii) the occurrence of supra-regional external events (EVENTS), (iv) the degree of transport connectivity (TRANSP), and (v) local resistance from civil society (RESIST). We adopted a (multi-data) case-based qualitative strategy for empirical research and applied the formalised procedure of within- and cross-case comparison offered by fuzzy-set Qualitative Comparative Analysis appropriate for the goal of this study. Based on set theory, QCA formally integrates contextual sensitivity to case specificities (within-case knowledge) with systematic comparative analysis (across-case knowledge). The research question the data set has been created to reply to is the following: which conditions, and combinations of conditions, enable the concordance between large-scale urban development projects and strategic spatial plans? The conditions (“independent variables”) considered are. STATE: the set of large-scale urban projects characterized by a high degree of state intervention and support in their formulation and implementation, PRIVATE: the set of large-scale urban projects characterized by a high degree of involvement of (inter)national private actors in their formulation and implementation, EVENTS: the set of large-scale strategic projects whose formulation and implementation have been strongly affected by unforeseen international events and/or global trends, TRANSP: the set of large-scale strategic projects with a high degree of road and/or transit connectivity, and RESIST: set of large-scale strategic projects whose realization has been characterized by resistances that have substantially delayed or modified the project implementation. The outcome (“dependent variable”) under analysis is CONCOR: the set of large-scale urban projects having a high degree of concordance/alignment/integration with strategic spatial plans 3. The data set lsUDPs 3.1 Selection of cases and data collection To generate the current data set on large-scale urban development projects in European urban regions (data set "lsUDPs"), we identified 35 large-scale urban development projects in a sample of the 21 Western urban regions considered in the CONCUR project (see supra, Hersperger et al. 2019): Amsterdam, Barcelona, Copenhagen, Hamburg, Lyon, Manchester, Milan, Stockholm, Stuttgart. The criteria we followed to identify the 35 large-scale urban development projects are: geographical location, size (large-scale), site (located either in the city core or in the larger urban region) and urban function (e.g. housing, transportation infrastructures, service and knowledge economic functions). Employing these criteria facilitated the selection of diverse large-scale urban development projects while still ensuring sufficient comparability. In 2016, we performed 47 in-depth interviews with experts in urban and regional planning and large-scale strategic projects and infrastructure (i.e. academics and practitioners) about the formulation, implementation and development (1990s–2010s) of each project in each of the 9 selected urban regions. On average, each interviewee answered questions on 3.1 large-scale urban development projects. Three cases were subdivided into two cases because a clear differentiation between specific implementation stages was identified by the interviewees (expansion of the Barcelona airport, cases “bcn_airport80-90” and “bcn_airport00-16”; realisation of Lyon Part-Dieu, cases “lyo_partdieu70-90” and “lyo_partdieu00-16”; MediaCityUK, cases “man_salfordquays80-00” and “man_mediacityuk00-16”). Therefore, from the initial 35 cases, the final number of analysed cases in the lsUDPs dataset is 38. 3.2 The data set lsUDPs: Data management and operationalisation Interviews were fully transcribed and analysed through MAXQDA (version 12.3, VERBI GmbH, Berlin, Germany), and intercoder agreement was evaluated on a sample of nine interviews. We also compiled “synthetic case descriptions” (SCD) for each case (totalling more than 160 SCDs) to spot potential inconsistencies among interviewees’ accounts and to facilitate completion of the “calibration table” for each case (see below). An online expert survey distributed to the interviewees (response rate 78%) helped systematise the information collected during the interviews. We also consulted both academic and gray literature on the case studies to check for possible ambiguity and inconsistencies in the interview data, and to solve discrepancies between our assigned set membership scores and questionnaire values. Site visits were also carried out to retrieve additional information on the selected cases. For each case (i.e. each of the 38 selected large-scale urban development projects), we operationalised each condition (i.e. STATE, PRIVATE, EVENTS, TRANSP, RESIST) and the outcome (CONCOR) in terms of sets, for subsequent application of Qualitative Comparative Analysis. This process is called “calibration”; we used a number of indicators for each condition to qualitatively assess each large-scale project across the conditions. The case-based qualitative assessment was then transformed into fuzzy-set membership values. Fuzzy-set membership values range from 0 to 1, and should be conceived as “fundamentally interpretative tools” that “operationalize theoretical concepts in a way that enhances the dialogue between ideas and evidence” (Ragin 2000:162, in “Fuzzy-set Social Science”. Chicago: University Press). We employed a four-value fuzzy-set scale (0, 0.33, 0.67, 1) to “quantify” into set membership scores the individual histories of cases retrieved from interview data. Only the condition TRANSP was calibrated as a crisp-set (0, 1). The translation of qualitative case-based information into numerical fuzzy-set membership values was iteratively performed by populating a calibration table following standard practices recently emerged in QCA when dealing with qualitative (interview) data.22 years ago
- This data set includes material and results described in the related research article: Bergfeld, B., van Herwijnen A., Bobillier, G., Rosendahl P., Weißgraeber P., Adam V., Dual, J., and Schweizer, J.: Temporal evolution of crack propagation characteristics in a weak snowpack layer: conditions of crack arrest and sustained propagation, Natural Hazards and Earth System Sciences, 23, 293-315, https://doi.org/10.5194/nhess-23-293-2023, 2023. We performed a series of propagation saw test experiments, up to ten meters long, over a period of 10 weeks and analyzed these using digital image correlation techniques. We derived the elastic modulus of the slab, the elastic modulus of the weak layer and the specific fracture energy of the weak layer with a homogeneous and a layered slab model. During crack propagation, we measured crack speed, touchdown distance and the energy dissipation due to compaction and dynamic fracture. Our data set provides unique insight and valuable data to validate models.42 years ago
- This poster was originally created for the swissuniversities Open Science Action Plan: Kick-Off Forum, and showed to the audience on 17.10.2019. It illustrates how the environmental data portal EnviDat provides the tools for fostering Open Science and Reproducibility of scientific research at WSL. Supporting open science is a highly relevant user requirement for EnviDat and for implementing FAIR (Findability, Accessibility, Interoperability and Reusability) principles at dataset level. EnviDat encourages WSL scientists to complement data publication with a complete description of research methods and the inclusion of the open source software, code or scripts used for processing the dataset or for obtaining the published results. By openly publishing open software (e.g. as Jupyter notebooks) alongside research data sets, researchers can contribute to mitigate reproducibility issues. EnviDat also promotes and supports, where possible and practical, the publication of software as Jupyter notebooks. Jupyter notebooks provide a solution for improved documentation and interactive execution of open code in a wide range of programming languages (Python, R, Octave/Matlab, Java or Scala). These programming languages are widely used in environmental research at WSL and well supported by the Jupyter-compatible kernels. We have sucessfully interfaced EnviDat-hosted notebooks with the WSL High-Performance Computing (HPC) Linux Cluster through a JupyterHub/JuypterLab beta installation on the HPC cluster implemented in close collaboration with the WSL IT-Services. For existing software that cannot be easily migrated to Jupyter Notebooks, the Open Science and Reproducibility is assisted by containerisation. We have proven that several Singularity containers can successfully run on WSL's HPC cluster. Finally, the researchers can upload the data/results complemented by code (e.g. as Jupyter Notebooks, or Singularity containers) and any additional documentation in EnviDat. Consequently, they will receive a DOI for the entire dataset, which they can reference in their science paper in order to publish a more reproducible research. _License_: This poster is released by WSL and the EnviDat team to the public domain under a Creative Commons 4.0 CC0 "No Rights Reserved" international license. You can reuse this poster in any way you want, for any purposes and without restrictions.12 years ago
- In January 2020 a social network analysis survey was conducted among forest policy stakeholders (at the organizational level) from the Canton of Lucerne as well as the national level. The aim was to elicit positions relative to a set of policy options currently discussed with respect to carbon mitigation and sequestration services of the forest, i.e. forest management and to establish information and collaboration network relations in order to identify actor coalitions as inspired by the "actor coalition framework" approach to policy analysis. Of the 66 questionnaires sent out, 51 were answered (77%). Only one additional organization was indicated as being missing from the provided list of stakeholder organizations.22 years ago
- This dataset contains the parameters used in the statistical analyses for the manuscript SREP-19-40170-T, submitted in Scientific Reports. This study is part of the WSL Drought Initiative 2018 (C3 - Analysis of the beech litterfall of the drought year 2018). Data originate from the Long-term Forest Ecosystem Research Programme LWF (litterfall, soil matric potential, deposition (precipitation) and meteo (temperature)), and from the Swiss Federal Office of Meteorology and Climatology MeteoSwiss (pollen). __Datafile:__ _LWF_beech_plots_litterfall_pollen.xlsx_ 1. Sheet _extreme_weather_: values used for analysis of weather conditions in strongest mast years compared to years with fruit abortion. 2. Sheet _weather_and_resource_allocation_: values used for analysis of weather impacts on mast occurrence and resource allocation models.12 years ago
- A multitude of physical and biological processes on which ecosystems and human societies depend are governed by climatic conditions. Understanding how these processes are altered by climate change is central to mitigation efforts. Based on mechanistically downscaled climate data, we developed a set of climate-related variables at yet unprecedented spatiotemporal detail as a basis for environmental and ecological analyses. We created gridded data for near-surface relative humidity (hurs), cloud area fraction (clt), near-surface wind speed (sfcWind), vapour pressure deficit (vpd), surface downwelling shortwave radiation (rsds), potential evapotranspiration (pet), climate moisture index (cmi), and site water balance (swb), at a monthly temporal and 30 arcsec spatial resolution globally starting 1980 until 2018. At the same spatial resolution, we further estimated climatological normals of frost change frequency (fcf), snow cover days (scd), potential net primary productivity (npp), growing degree days (gdd), and growing season characteristics for the periods 1981-2010, 2011-2040, 2041-2070, and 2071-2100, considering three shared socioeconomic pathways (SSP126, SSP370, SSP585) and five Earth system models. Time-series variables showed high accuracy when validated against observations from meteorological stations. Climatological normals were also highly correlated to observations although some variables showed notable biases, e.g., snow cover days (scd). Together, the data sets presented here allow improving our understanding of patterns and processes that are governed by climate, including the impact of recent and future climate changes on the world’s ecosystems and associated services to societies.22 years ago
- Switzerland has a reliable and cost efficient energy system. Due to phase out of nuclear energy it is necessary to find new options to maintain this powerful energy system. The Swiss energy strategy 2050 aims to reduce CO2-emissions, increase efficiency and promote renewable energies. The Swiss Federal Institute for Forest, Snow and Landscape Research (WSL) examined relevant woody and non-woody biomass quantities (cubic meters, fresh-, dry weight) and their energy potentials (in Petajoules: primary energy and biomethane) with a similar methodological approach. The work was done within the frame of the Swiss Competence Centers for Energy Research (SCCER) especially in line with the SCCER Biomass for Swiss energy future (Biosweet). With a uniform and consistent approach for the current potentials ten biomass categories were estimated and aggregated for the whole of Switzerland. In this context solutions for the technical, social and political challenges are promoted. First, considering the different biomass resources characteristics and available data, appropriate methods at the finest scale possible were elaborated to estimate the annual quantities which could theoretically be collected (theoretical potential). Then, explicit and rational restrictions for sustainable bio-energy production were defined according to the current state of the art and subtracted from the theoretical potential to obtain the sustainable potential. The main restrictions are competing material utilizations, environmental factors and supply costs. Finally, the additional sustainable potential was estimated considering the current bioenergy production. Our main purpose was to provide potentials for developing conversion technologies as well as a detailed and comprehensive basis of the Swiss biomass potentials for energy use for economic and political decision makers. The complete report is available under https://www.dora.lib4ri.ch/wsl/islandora/object/wsl%3A13277/datastream/PDF/view82 years ago
- High quality meteorological data are needed for long-term forest ecosystem research, particularly in the light of global change. The long-term data series published here comprises almost 20 years of measurements for two meteorological stations in Visp in Switzerland where one station is located within a natural mixed forest stand (VSB) with Scots pine (_Pinus sylvestris_; 40-80 yrs) as dominant tree species. A second station is situated in the very vicinity outside of the forest (field station, VSF). The meteorological time series are presented in hourly time resolution of air temperature, relative humidity, precipitation, photosynthetically active radiation (PAR) and wind speed. Visp is part of the Long-term Forest Ecosystem Research Programme (LWF) established and maintained by the Swiss Federal Research Institute WSL.72 years ago
- Snowprofile from 11 observer sites in Switzerland compiled for the Global Climate Observing System (GCOS). Height of snow (cm) and snow water equivalent (mm) are recorded every 2 weeks since the 1947 (depending on station). Attached metadata file gives details of each station.22 years ago
- High quality meteorological data are needed for long-term forest ecosystem research, particularly in the light of global change. The long-term data series published here comprises almost 20 years of measurements for two meteorological stations in Neunkirch in Switzerland where one station is located within a natural deciduous forest stand (NEB) with European beech (_Fagus sylvatica_; 160 yrs), sycamore maple (_Acer pseudoplatanus_; 160 yrs) and lime trees (_Tilia sp._; 110 yrs) as dominant tree species. A second station is situated in the very vicinity outside of the forest (field station, NEF). The meteorological time series are presented in hourly time resolution of air temperature, relative humidity, precipitation, photosynthetically active radiation (PAR) and wind speed. Neunkirch is part of the Long-term Forest Ecosystem Research Programme (LWF) established and maintained by the Swiss Federal Research Institute WSL.72 years ago
- Volume of stemwood with bark of all trees and shrubs starting at 12 cm dbh cut between two inventories. *In the calculation no D7/tree height data were used. The values calculated like this have not been corrected for bias, but allow for cantons or forest districts a more robust estimation of changes and could thus be better interpreted. __Citation:__ > _Abegg, M.; Brändli, U.-B.; Cioldi, F.; Fischer, C.; Herold-Bonardi, A.; Huber M.; Keller, M.; Meile, R.; Rösler, E.; Speich, S.; Traub, B.; Vidondo, B. (2014). Fourth national forest inventory - result tables and maps on the Internet for the NFI 2009-2013 (NFI4b). [Published online 06.11.2014] Available from World Wide Web http://www.lfi.ch/resultate/ Birmensdorf, Swiss Federal Research Institute WSL. [doi:10.21258/1057112](https://doi.org/10.21258/1057112)_22 years ago
- Dry weight (mass) of the stemwood with bark of the living trees and shrubs starting at 12 cm dbh. The correction for bias with the sample Tarif trees may be so drastic that it results in negative values with small numbers of trees. __Citation:__ > _Abegg, M.; Brändli, U.-B.; Cioldi, F.; Fischer, C.; Herold-Bonardi, A.; Huber M.; Keller, M.; Meile, R.; Rösler, E.; Speich, S.; Traub, B.; Vidondo, B. (2014). Fourth national forest inventory - result tables and maps on the Internet for the NFI 2009-2013 (NFI4b). [Published online 06.11.2014] Available from World Wide Web http://www.lfi.ch/resultate/ Birmensdorf, Swiss Federal Research Institute WSL. [doi:10.21258/1057112](https://doi.org/10.21258/1057112)_22 years ago
- Processed ground temperature measurements at the Gemsstock permafrost borehole in canton Uri, Switzerland. The borehole is located at 2940 m asl on a steep (50°) North-West slope (315°). The surface material is bedrock and borehole depth is 40 m. Thermistors used YSI 44008. Year of drilling 2006. This borehole is part of the Swiss Permafrost network, PERMOS (www.permos.ch). Contact phillips@slf.ch for details of processing applied. __Publications__ 1. A. Haberkorn, M. Phillips, R. Kenner, H. Rhyner, M. Bavay, S.P. Galos, M. Hoelzle. Thermal regime of rock and its relation to snow cover in steep Alpine rock walls: Gemsstock, central Swiss Alps. 2015. Geografiska Annaler: Series A, Physical Geography. Volume 97. Issue 3. 579–597. http://dx.doi.org/10.1111/geoa.12101. 10.1111/geoa.12101. 2. R. Kenner, M. Phillips, C. Danioth, C. Denier, P. Thee, A. Zgraggen. Investigation of rock and ice loss in a recently deglaciated mountain rock wall using terrestrial laser scanning: Gemsstock, Swiss Alps. 2011. Cold Regions Science and Technology. Volume 67. Issue 3. 157–164. http://dx.doi.org/10.1016/j.coldregions.2011.04.006. 10.1016/j.coldregions.2011.04.006.32 years ago
- The data was collected with a Wingtra Gen II drone and a Sony RX1R II sensor. In total, 10 flights were conducted at different dates, both in summer and winter. A DSM, an orthophoto, a snow depth raster and the original drone images from every flight are available at a high resolution (10cm and 3cm, respectively).12 years ago
- The here presented code generates discrete three-dimensional, RAMMS::ROCKFALL readable deadwood log files (.pts-format) of windtrown forests, including the pilling effect due to slightly different throw directions.42 years ago
- Continuous measurement of soil matrix potential at 15, 50 and 80 cm depth with Decagon MPS-2 sensors ### Purpose: ### Improve the available data for the calibration or validation of the water cycle modells, i.e. the determination of the water flux needed for calculating the leaching fluxes.12 years ago
- Increase in the volume of stemwood with bark of the trees and shrubs starting at 12 cm dbh that have survived between two inventories and of the losses (modelled for the half period), plus the volume of the gains. The correction for bias with the sample Tarif trees may be so drastic that it results in negative values with small numbers of trees. __Citation:__ > _Abegg, M.; Brändli, U.-B.; Cioldi, F.; Fischer, C.; Herold-Bonardi, A.; Huber M.; Keller, M.; Meile, R.; Rösler, E.; Speich, S.; Traub, B.; Vidondo, B. (2014). Fourth national forest inventory - result tables and maps on the Internet for the NFI 2009-2013 (NFI4b). [Published online 06.11.2014] Available from World Wide Web http://www.lfi.ch/resultate/ Birmensdorf, Swiss Federal Research Institute WSL. [doi:10.21258/1057112](https://doi.org/10.21258/1057112)_32 years ago
- Meterological station at the [Ritigraben permafrost borehole](http://www.envidat.ch/dataset/rit1) (RIT_0102) in canton Valais, Switzerland. The station is located at 2690 m asl on a flat site.12 years ago
- The dataset "Lake_climate_change_scenarios_CH2018" provides simulation-based climate change impact scenarios for perialpine lakes in Switzerland. These transient future scenarios were produced by combining the hydrologic model PREVAH with the hydrodynamic model MIKE11 to simulate daily lake water level (Lake_water_level_scenarios_CH2018.xls) and outflow scenarios (Lake_outflow_scenarios_CH2018.xls) from 1981 to 2099, using the Swiss Climate Change Scenarios CH2018. The future scenarios contain a total of 39 model members for three Representative Concentration Pathways, RCP2.6 (concerted mitigation efforts), RCP4.5 (limited climate mitigation) and RCP8.5 (no climate mitigation measures). These scenarios result from the study titled "Lower summer lake levels in regulated perialpine lakes, caused by climate change," authored by Wechsler et al. in 2023. The dataset emphasizes four specific Swiss lakes, each subject to different degrees of lake level management: an unregulated lake (Lake Walen), a semi-regulated lake (Lake Brienz), and two regulated lakes (Lake Zurich and Lake Thun). In addition, the file (Lake_characteristics.xlsx) includes data used in the modeling process, encompassing the stage-area relation for the four lakes, stage-discharge relations for the unregulated and semi-regulated lakes, and lake level management rules for the two regulated lakes.32 years ago
- Increment with ingrowth minus the mortality. *In the calculation no D7/tree height data were used. The values calculated like this have not been corrected for bias, but allow for cantons or forest districts a more robust estimation of changes and could thus be better interpreted. __Citation:__ > _Abegg, M.; Brändli, U.-B.; Cioldi, F.; Fischer, C.; Herold-Bonardi, A.; Huber M.; Keller, M.; Meile, R.; Rösler, E.; Speich, S.; Traub, B.; Vidondo, B. (2014). Fourth national forest inventory - result tables and maps on the Internet for the NFI 2009-2013 (NFI4b). [Published online 06.11.2014] Available from World Wide Web http://www.lfi.ch/resultate/ Birmensdorf, Swiss Federal Research Institute WSL. [doi:10.21258/1057112](https://doi.org/10.21258/1057112)_22 years ago
- This dataset contains the population evolution of a pest and its biocontrol agent in terms of presence proportion at gall level and absolute number of insects. The study area extends from the Cuneo region (Piedmont, Italy) to southern Switzerland. In order to provide a complete range of data covering the entire process from the pest arrival to complete biological control by its natural enemy T. sinensis, a space-for-time substitution approach has been adopted so as to create a temporal gradient of the epidemic stages over the whole study area. The southernmost Swiss sites roughly represent the arrival and establishment of the pest without the presence of the natural enemy, the central ones the early epidemic stage and the epidemic peak, whereas the northern ones the end of the epidemic with the beginning of the biocontrol. The Italian ones represent the beginning of the equilibrium between the two population as well as the situation with stable T. sinensis populations on the long term. These data are used in the paper entitled: Torymus sinensis local and regional early population dynamics in the Insubrian and Piedmont regions12 years ago
- In the context of the WoodFlow project (https://woodflow.wsl.ch), an extensive database was developed which documents recruited and transported quantities of large wood (woody debris) together with the associated catchment and flood-specific parameters. Transported large wood volumes were related to catchment area, forest cover, stream length, peak discharge, runoff volume, sediment load, and precipitation. The dataset covers flood events mostly from Switzerland, but also from other alpine catchments in Germany, Italy France and Japan.12 years ago
- This dataset contains the output and reference data published in the paper "Automated snow avalanche release area delineation - validation of existing algorithms and proposition of a new object-based approach for large scale hazard indication mapping" Yves Bühler, Daniel von Rickenbach, Andreas Stoffel, Stefan Margreth, Lukas Stoffel, Marc Christen (2018) Natural Hazards And Earth System Sciences. Abstract: Snow avalanche hazard is threatening people and infrastructure in all alpine regions with seasonal or permanent snow cover around the globe. Coping with this hazard is a big challenge and during the past centuries, different strategies were developed. Today, in Switzerland, experienced avalanche engineers produce hazard maps with a very high reliability based on avalanche cadastre information, terrain analysis, climatological datasets and numerical modelling of the flow dynamics for selected avalanche tracks that might affect settlements. However, for regions outside the considered settlement areas such area-wide hazard maps are not available mainly because of the too high cost, in Switzerland and in most mountain regions around the world. Therefore, hazard indication maps, even though they are less reliable and less detailed, are often the only spatial planning tool available. To produce meaningful and cost-effective avalanche hazard indication maps over large regions (regional to national scale), automated release area delineation has to be combined with volume estimations and state-of-the-art numerical avalanche simulations. In this paper we validate existing potential release area (PRA) delineation algorithms, published in peer-reviewed journals, that are based on digital terrain models and their derivatives such as slope angle, aspect, roughness and curvature. For validation, we apply avalanche cadastre data from three different ski resorts in the vicinity of Davos, Switzerland, where experienced ski-patrol staff mapped most avalanches in detail since many years. After calculating the best fit input parameters for every tested algorithm, we compare their performance based on the reference datasets. Because all tested algorithms do not provide meaningful delineation between individual potential release areas (PRA), we propose a new algorithm based on object-based image analysis (OBIA). In combination with an automatic procedure to estimate the average release depth (d0), defining the avalanche release volume, this algorithm enables the numerical simulation of thousands of avalanches over large regions applying the well-established avalanche dynamics model RAMMS. We demonstrate this for the region of Davos for two hazard scenarios, frequent (10 – 30 years return period) and extreme (100 – 300 years return period). This approach opens the door for large scale avalanche hazard indication mapping in all regions where high quality and resolution digital terrain models and snow data are available.22 years ago
-  LWF Plot Visp - Community: Visp / canton VS - Date of installation: 13 March 1996 - Size of the plot: 2 ha - Altitude: 657-733 m - Mean slope: 80% - Geology (in German): Penninikum, Jura, Bündnerschiefer; Kalkphyllite, Hängeschutt - Provisional soil type (WSL): Calcaric Cambisol - Woodland association after EK72: =~= 38: Arabidi turritae-Quercetum pubescentis - Main tree species: Pinus sylvestris - Management system: high forest - Silvicultural system: unmanaged - Top-height diameter (quadratic average diameter of the 100 thickest trees per ha): 53.9 cm - Number of trees BHD >= 12 cm (2011): 650 - Maximum tree age: Pinus sylvestris uneven-aged 40-80 yr More Information: https://www.wsl.ch/en/forest/forest-development-and-monitoring/long-term-forest-ecosystem-research-lwf/sites/visp.html22 years ago
- # Supplementary Data Sample Plot Inventory Sihlwald The Sihlwald is one of the largest contiguous beech forests in the Swiss Plateau region. In the year 2000, timber harvesting was abandoned. Since 2007 the forest has been under strict protection as a natural forest reserve on an area of 1098 ha and since 2008 as a cantonal nature and landscape conservation area (SVO Sihlwald). Since 2010, it carries the national label ‘Nature discovery park’ (‘Naturerlebnispark’). As part of the national monitoring in nature forest reserves, a sampling inventory (calipering threshold of 7 cm) with 226 plots on an area of 917 ha was carried out in the Sihlwald in autumn and early winter 2017. The aim was to describe the state and development of the forest structure and make comparisons with earlier sampling inventories in the same area from 1981, 1989 and 2003. This dataset contains supplementary tables for the publication by Brändli et al. (2020). The metadata file describes the structure of the tables.72 years ago
- Wood volume of branches with bark at least 7 cm in diameter (limit for coarse wood) of all living trees and shrubs starting at 12 cm dbh that were present in the pre-inventory and cut meanwhile. __Citation:__ > _Abegg, M.; Brändli, U.-B.; Cioldi, F.; Fischer, C.; Herold-Bonardi, A.; Huber M.; Keller, M.; Meile, R.; Rösler, E.; Speich, S.; Traub, B.; Vidondo, B. (2014). Fourth national forest inventory - result tables and maps on the Internet for the NFI 2009-2013 (NFI4b). [Published online 06.11.2014] Available from World Wide Web http://www.lfi.ch/resultate/ Birmensdorf, Swiss Federal Research Institute WSL. [doi:10.21258/1057112](https://doi.org/10.21258/1057112)_22 years ago
- # Background Urban ecosystems are associated with socio-ecological conditions that can filter and promote taxa. However, the strength of the effect of ecological filtering on biodiversity could vary among biotic and abiotic factors. Here, we provide the data used to investigate the effects of habitat amount, temperature, and host-enemy biotic interactions in shaping communities of cavity-nesting bees and wasps (CNBW) and their natural enemies. To do so, we installed trap-nests in 80 sites distributed along urban intensity gradients in 5 European cities (Antwerp, Paris, Poznan, Tartu and Zurich). We quantified the species richness and abundance of CNBW hosts and their natural enemies, as well as two performance traits (survival and parasitism) and two life-history traits (sex ratio and number of offspring per nest for the hosts). The dataset contains: * The taxonomic metrics on CNBW * The taxonomic metrics on the natural enemies from CNBW * The life-history traits and performance traits32 years ago
- 1. Stand characteristics of treeline ecotone along 18 elevational gradients of the Ural mountains. 2. Extrapolated climate data at treeline using nearby meteo station (1976-2006). 3. Air and soil temperatures measured in situ at treeline in the South and Polar Urals. Soil temperature sensors were placed at 10 cm depth in open areas in between tree clusters but not under tree canopy. 4. Further plot specific information is available upon request.12 years ago
- High quality meteorological data are needed for long-term forest ecosystem research, particularly in the light of global change. The long-term data series published here comprises almost 20 years of measurements for two meteorological stations in Vordemwald in Switzerland where one station is located within a natural mixed forest stand (VOB) with European silver fir (_Abies alba_; 110 yrs) and oak trees (_Quercus sp._; 190-210 yrs) as dominant tree species. A second station is situated in the very vicinity outside of the forest (field station, VOF). The meteorological time series are presented in hourly time resolution of air temperature, relative humidity, precipitation, photosynthetically active radiation (PAR) and wind speed. Vordemwald is part of the Long-term Forest Ecosystem Research Programme (LWF) established and maintained by the Swiss Federal Research Institute WSL.72 years ago
- Swiss National Forest Inventory. Results of the fourth survey 2009–2017. The collection of data for the fourth National Forest Inventory (NFI) was carried out from 2009 to 2017, on average eight years after the third survey. The findings about state and development of Swiss forests are described and explained in detail. The report is structured according to the European criteria and indicators for sustainable forest management, namely: forest resources, health and vitality, wood production, biological diversity, protection forest and social economy. Finally, conclusions about sustainability are drawn based on the NFI findings. Keywords: forest area, growing stock, increment, yield, forest structure, forest condition, timber production, biodiversity, protection forest, recreation, sustainability, results National Forest Inventory, Switzerland Schweizerisches Landesforstinventar. Ergebnisse der vierten Erhebung 2009–2017. In den Jahren 2009 bis 2017 fanden die Erhebungen zum vierten Schweizerischen Landesforstinventar (LFI) statt, im Durchschnitt acht Jahre nach der dritten Erhebung. Die Resultate über den Zustand und die Entwicklung des Schweizer Waldes werden umfassend dargestellt und erläutert. Der Bericht ist thematisch strukturiert nach den europäischen Kriterien und Indikatoren zur nachhaltigen Bewirtschaftung des Waldes: Waldressourcen, Gesundheit und Vitalität, Holzproduktion, biologische Vielfalt, Schutzwald und Sozioökonomie. Eine Bilanz zur Nachhaltigkeit, basierend auf LFI-Ergebnissen, schliesst die Publikation ab. Keywords: Waldfläche, Holzvorrat, Zuwachs, Nutzung, Waldaufbau, Waldzustand, Holzproduktion, Biodiversität, Schutzwald, Erholung, Nachhaltigkeit, Ergebnisse Landesforstinventar, Schweiz Content license: All rights reserved. Copyright © 2020 by WSL, Birmensdorf.32 years ago
- This dataset contains modeled and experimental results for laboratory snow failure experiments and the concurrent acoustic emissions signatures for different loading rates. For modelling the snow failure we used a fiber bundle model that includes sintering and viscous deformation. The data underlay the figures in the publication "Modelling Snow Failure Behavior and Concurrent Acoustic Emissions Signatures with a Fiber Bundle Model" submitted for publication to "Geophysical Research Letters".12 years ago
- Data on dissolved organic and inorganic phosphorus and nitrogen concentrations in leachates and their corresponding fluxes from the litter layer, the Oe/Oa horizon, and the A horizon of two German beech forest sites. Leachate samples were taken in April 2018, July 2018, October 2018, Feb./Mar. 2019, and July 2019 with zero-tension lysimeters after artificial irrigation. Soil samples were taken in July 2019. For more details please refer to the publication.12 years ago
- This dataset contains the number of fatalities due to flood, debris flow, landslide, rockfall, windstorm, lightning, ice avalanche, earthquake and other processes like roof avalanche or lacustrine tsunami for each year since 1946. The following information is contained (by column and column title): * year * total number of hazard fatalities * number of fatalities by flood (German: Hochwasser, Überschwemmung). Flood includes people drowned in flooded or inundated areas or carried away in streams under high-water conditions. * number of fatalities by debris flow (German: Murgang). * number of fatalities by landslide (German: Erdrutsch). Landslide includes people killed by landslides and hillslope debris flows (German: Hangmure). * number of fatalities by rockfall (German: Steinschlag, Fels- und Bergsturz). * number of fatalities by windstorm (German: Sturm). Windstorm includes people killed by falling objects or trees during very strong wind conditions and people who drowned in lakes because their boat capsized during such conditions. * number of fatalities by lightning (German: Blitz). * number of fatalities by ice avalanche (German: Eislawine). * number of fatalities by earthquake (German: Erdbeben). * number of fatalities by other processes like roof avalanche, lacustrine tsunami (German: andere Prozesse wie Dachlawine, Tsunami im See). The data was collected based on newspaper research. For more information please refer to _Badoux, A., Andres, N., Techel, F., and Hegg, C.: Natural hazard fatalities in Switzerland from 1946 to 2015, Nat. Hazards Earth Syst. Sci., 16, 2747-2768, https://doi.org/10.5194/nhess-16-2747-2016, 2016._ The data collection is financed by the FOEN (with exception of the collection of the avalanche fatalities). The data contains the official statistics of the FOEN on fatalities due to flood, debris flow, landslide, rock fall and avalanche. __Restrictions: The data set is not complete.__ Only fatalities in or around settlements and on open transportation routes are included. More precisely, fatalities were not collected, when persons exposed themselves to a great danger on purpose. Or fatalities during leisure activities which are connected to a higher risk were not included (this includes e.g. canoeing or river surfing during flood, canyoning, mountaineering, climbing, walking or driving on a closed road). Fatalities by avalanches are collected at the WSL Institute for Snow and Avalanche Research SLF. You can download the avalanche fatalities per hydrological year [here](https://www.envidat.ch/dataset/avalanche-fatalities-switzerland-1936) and per calendar year [here](https://www.envidat.ch/dataset/avalanche-fatalities-per-calendar-year-since-1936). For a direct comparison with the fatalities presented here, please download the data set with the calendar years and do not consider fatalities in the backcountry (tour) or in terrain close to ski areas (offpiste).12 years ago
- In order to use the QGIS plugin ‘Seilaplan’ for digital cable line planning, a digital terrain model (DTM) is required. In this tutorial video, we show how to merge multiple DTM raster tiles into one file, using the QGIS tool ‘Virtual Raster’. This simplifies the digital planning of a cable line using the QGIS plugin ‘Seilaplan’. Please note that the tutorial language is German! Link to Seilaplan website: https://seilaplan.wsl.ch *************************** Für die Verwendung des QGIS Plugins Seilaplan zur digitalen Seillinienplanung ist ein digitales Höhenmodell (DHM) nötig. In diesem Tutorialvideo zeigen wir, wie man mit dem QGIS-Plugin Virtuelles Raster mehrere DHM-Kacheln zu einem einzigen Rasterfile zusammenfügen und abspeichern kann. Für die Seillinienplanung mit Seilaplan muss nun nur noch eine Datei, mein neues virtuelles Raster, ausgewählt werden. Link zur Seilaplan-Website: https://seilaplan.wsl.ch22 years ago
- Dry weight (mass) of dead, lying trees and shrubs starting at 12 cm dbh. This consists of the tree parts: roots, stemwood and also, depending on the degree of decomposition of the stem, the branch coarse wood. __Citation:__ > _Abegg, M.; Brändli, U.-B.; Cioldi, F.; Fischer, C.; Herold-Bonardi, A.; Huber M.; Keller, M.; Meile, R.; Rösler, E.; Speich, S.; Traub, B.; Vidondo, B. (2014). Fourth national forest inventory - result tables and maps on the Internet for the NFI 2009-2013 (NFI4b). [Published online 06.11.2014] Available from World Wide Web http://www.lfi.ch/resultate/ Birmensdorf, Swiss Federal Research Institute WSL. [doi:10.21258/1057112](https://doi.org/10.21258/1057112)_22 years ago
- The present content is part of the published paper Palka, G., Oliveira, E., Pagliarin, S., & Hersperger, A. M. (2021). Strategic spatial planning and efficacy: an analytic hierarchy process (AHP) approach in Lyon and Copenhagen. European planning studies, 29(6), 1174-1192. It contains the interviews, the survey, the report explaining survey and a xlxs table to save results.12 years ago
- This dataset contains all data on which the following publication below is based. Paper Citation: Risch Anita C., Zimmermann, Stefan, Moser, Barbara, Schütz, Martin, Hagedorn, Frank, Firn, Jennifer, Fay, Philip A., Adler, Peter B., Biederman, Lori A., Blair, John M., Borer, Elizabeth T., Broadbent, Arthur A.D., Brown, Cynthia S., Cadotte, Marc W., Caldeira, Maria C., Davies, Kendi F., di Virgilio, Augustina, Eisenhauer, Nico, Eskelinen, Anu, Knops, Johannes M.H., MacDougall, Andrew S., McCulley, Rebecca L., Melbourne, Brett A., Moore, Joslin L., Power, Sally A., Prober, Suzanne M., Seabloom, Eric W., Siebert, Julia, Silveira, Maria L. , Speziale, Karina L., Stevens, Carly J., Tognetti, Pedro M., Virtanen, Risto, Yahdjian, Laura, Ochoa-Hueso, Raul (accepted). Global impacts of fertilization and herbivore removal on soil net nitrogen mineralization are modulated by local climate and soil properties. Global Change Biology Please cite this paper together with the citation for the datafile. We assessed how the removal of mammalian herbivores (Fence) and fertilization with growth-limiting nutrients (N, P, K, plus nine essential macro- and micronutrients; NPK) individually, and in combination (NPK+Fence), affected potential and realized soil net Nmin across 22 natural and semi-natural grasslands on five continents. Our sites spanned a comprehensive range of climatic and edaphic conditions found across the grassland biome. We focused on grasslands, because they cover 40-50% of the ice-free land surface and provide vital ecosystem functions and services. They are particularly important for forage production and C sequestration. Worldwide, grasslands store approximately 20-30% of the Earth’s terrestrial C, most of it in the soil (Schimel, 1995; White et al., 2000).12 years ago
- To map and assess snow depth on different dates, 9 flights were conducted in the winter season of 2020/21 at the Latschüelfurgga in Davos. The data was captured with a Sony RX1R II mounted on a Wingtra drone and was processed with the Agisoft Metashape software. High-resolution DSMs, orthomosaics and snow height rasters, as well as the original RGB images from each flight are available.12 years ago
- Long term monitoring of natural forests provides insights into ecological processes shaping forests without human intervention. To study natural forest dynamics, the former chair of silviculture at the Swiss Federal Institute of Technology (ETH) initiated a network of forest reserves in the late 1940's. Since 2006, the monitoring is carried out in a cooperation project of the chair of Forest Ecology at ETH, the Swiss Federal Research Institute for Forest, Snow and Landscape Research (WSL) and the Federal Office for the Environment (FOEN). The project relaunch led to a streamlining of the reserve network, which now contains 33 of the original reserves and 16 new reserves. The main goal is to evaluate the effectiveness of the federal reserve policy by analysing to what extent forest reserves differ from managed forests in terms of structure, dynamics, and habitat quality.32 years ago
- Sum of the stem cross-section areas of all living trees and shrubs starting at 12 cm dbh (standing and lying) at a height of 1.3 m (dbh measurement height). __Citation:__ > _Abegg, M.; Brändli, U.-B.; Cioldi, F.; Fischer, C.; Herold-Bonardi, A.; Huber M.; Keller, M.; Meile, R.; Rösler, E.; Speich, S.; Traub, B.; Vidondo, B. (2014). Fourth national forest inventory - result tables and maps on the Internet for the NFI 2009-2013 (NFI4b). [Published online 06.11.2014] Available from World Wide Web http://www.lfi.ch/resultate/ Birmensdorf, Swiss Federal Research Institute WSL. [doi:10.21258/1057112](https://doi.org/10.21258/1057112)_42 years ago
- The dataset contains the soil wetness monitoring data from the publication Wicki et al. (2022). It was collected in Wasen i.E. (Napf area, Switzerland). The monitoring data is quality-controlled and aggregated to hourly values and it is provided for the study period 2019-04-05 to 2022-04-30. The following information is contained (by column): * Timestamp (UTC+1 time zone) * Site: Slope (47.02486 N, 7.81960 E), Flat (47.02302 N, 7.81760 E) * Sensor type * Measure: VWC = volumetric water content [m3 m-3], MP = matric potential [hPa], TEMP = temperature [°C], PREC = precipitation [mm] * Sensor number (per site each sensor is provided a unique identifier) * Installation depth [m] * Homogenization flag: If the data is considered homogeneous, it is given the flag 1, else the flag 0 is given * Sensor value * Normalized value: Normalization was conducted for VWC (saturation) and MP values Wicki, A., Lehmann, P., Hauck, C., and Stähli, M.: Impact of topography on in-situ soil wetness measurements for regional landslide early warning – a case study from the Swiss Alpine Foreland, Nat. Hazards Earth Syst. Sci. Discuss. [preprint], https://doi.org/10.5194/nhess-2022-211, in review, 2022.12 years ago
- List of key debris flow variables from the WSL Illgraben monitoring station (2019-2022) such as occurrence date and time, peak flow depth, peak flow velocity, total volume and bulk density. This table contains values based on our current analysis methods. The list will be updated annually after each debris flow season, and as our methods continue to improve, individual values may change slightly in the future.12 years ago
- This file contains isotopic and environmental data from seven individuals of Larix decidua, sampled at two sites located at an elevation of 1300 meters above sea level in the Lötschental valley, Switzerland, during the period of 2012-2013. Within this file, you will find two datasets. The first dataset, labeled 'd18Ocellulose,' comprises individual intra-annual d18O cellulose measurements, along with corresponding temperature, vapor pressure deficit, and relative humidity data. These measurements are aggregated for the period during which each tree-ring section was in the cell wall formation phase. The second dataset, identified as 'd18ONW-XYL,' includes individual d18O measurements for both xylem and needle water, in conjunction with temperature, vapor pressure deficit, and relative humidity data.42 years ago
- This dataset contains forest canopy structure data acquired in a spruce forest at Laret, Switzerland, and a pine forest at Sodankylä, Finland. Data include: * Hemispherical photographs taken at transect intersection points of 13 experimental plots (40x40m each) * a Canopy Height Model (tree height map) derived by rasterizing airborne LiDAR data, encompassing the entire simulation domain at Laret (150'000 m2) These data provide the necessary basis for creating canopy structure datasets to be used as input to the forest snow snow model FSM2. These datasets, the model input derivatives and the radiation and snow modelling are described in detail in the following publication: _Mazzotti, G., Webster, C., Essery, R., and Jonas, T. (2021) Improving the physical representation of forest snow processes in coarse-resolution models: lessons learned from upscaling hyper-resolution simulations. Water Resources Research 57, e2020WR029064. [doi: 10.1029/2020WR029064](https://doi.org/10.1029/2020WR029064)_ This publication must be cited when using the data. ### See also: For additional information on the FSM2 model, see the corresponding [GitHub repository](https://github.com/GiuliaMazzotti/FSM2/tree/hyres_enhanced_canopy) The datasets and the model have also been used in _Mazzotti et al. (2020) Process-level evaluation of a hyper-resolution forest snow model using distributed multi-sensor observations. [doi: 10.1029/2020WR027572](https://doi.org/10.1029/2020WR027572)22 years ago
- Throughfall, litterflow and soil solution were sampled during one whole year under five Oriental beech trees in a mixed Hyrcanian beech forest. The amounts of Ca2+, Mg2+, K+ and Na+ in these fluxes were calculated based on their concentrations and the sampled volumes, and subsequently compared with the respective fluxes in the rainfall and soil solution of an adjacent forest gap. In addition six soil profiles, one close to every single tree and one in the forest gap, were analyzed for pH, CaCO3, organic matter and texture.12 years ago
- This dataset contains all data on which the following publication below is based. Paper Citation: Risch, A. C.; Zimmermann, S.; Ochoa-Hueso, R.; Schütz, M.; Frey, B.; Firn, J. L.; Fay, P. A.; Hagedorn, F.; Borer, E. T.; Seabloom, E. W.; et al. Soil net nitrogen mineralisation across global grasslands. Nat. Commun. 2019, 10 (1), 4981 (10 pp.). doi.org/10.1038/s41467-019-12948-2 Please cite this paper together with the citation for the datafile. We conducted coordinated measurements of realised and potential soil net Nmin, and assessed water holding capacity, bulk density, C and N content, texture, pH, pore space, microbial biomass, and archaeal (AOA) and bacterial (AOB) ammonia oxidiser abundance using identical materials and methods across 30 grasslands on six continents. The sites covered a globally relevant range of climatic and edaphic conditions. Climate data was obtained from worldclim - Global climate data https://www.worldclim.org/12 years ago
- This dataset includes all data and simulation files presented in the publication: Bender et al. 2020. Changes in climatology, snow cover and ground temperatures at high alpine locations, DOI: 10.3389/feart.2020.00100. This includes: * meteorological forcing, * climate change timeries and * simulation files together with * snow depth * ground temperature __Please refer to the following publication for further details which should be cited when using this dataset:__ __Bender et al. 2020. Changes in climatology, snow cover and ground temperatures at high alpine locations, DOI: 10.3389/feart.2020.00100.__52 years ago
- Angle of repose experiments were performed with different snow types at temperatures between -2 and -40°C. They were used to examine granular snow dynamics on the grain-scale with focus on the role of grain shape and cohesion. The angle of repose was observed by sieving snow onto a round, freestanding base until a stationary heap was formed. This dataset consists of 1) the images of the experimental heaps that were taken to determine the angle of repose, 2) one binary 3D micro computed tomography image of each snow type. The CT images were taken with the SLF micro-CT40 to characterize snow properties and grain shape. The experiments with natural snow types (rounded and faceted grains) and spherical model snow allowed for an examination of the differences in granular properties between natural grain shapes and spherical particles in view of Discrete Element Modelling. With the chosen temperatures, the effect of sintering could be observed that increases the angle of repose with increasing temperature.22 years ago
- This dataset contains datasets of sub-canopy meteorological variables acquired in coniferous forest stands in Switzerland (Davos, Engadine) and Finland (Sodankylä) during the winters 2018 and 2019. The data are presented and used in the publication: Mazzotti, G., Essery, R., Webster, C., Malle, J., & Jonas T. (2020) Process-level evaluation of a high-resolution forest snow model using observations from mobile multi-sensor platforms Water Resources Research, under review The above publication must be cited when using this dataset, and the user is referred to the publication for additional detail. Data are grouped into 4 folders: 1) Point data includes wind speed data measured with stationary meteorological stations 2) Transect data includes data of incoming short- and longwave radiation, air and snow surface temperature acquired with an automated calblecar system along within-stand transects 3) Grid data includes data of incoming short- and longwave radiation, air and snow surface temperature acquired on 40x40m gridded plots using a handheld instrument, as well as snow depth data measured at the same grids. Canopy structure information derived from hemispherical images is included for each all surveyed locations as well, and an overview of the field sites is provided.52 years ago
- Richness, site occurrence and abundance data of bees, beetles, birds, hoverflies, net-wingeds, true bugs, snails, spiders, milipides, wasps collected in the city of Zurich using different sampling techniques, and the environmental variables for each sampling site. Data are provided on request to contact person against bilateral agreement.52 years ago
- High quality meteorological data are needed for long-term forest ecosystem research, particularly in the light of global change. The long-term data series published here comprises almost 20 years of measurements for two meteorological stations in Bettlachstock in Switzerland where one station is located within a natural mixed forest stand (BTB) with European beech (_Fagus sylvatica_; 170-190 yrs), European silver fir (_Abies alba_; 190 yrs) and Norway spruce (_Picea abies_; 200 yrs) as dominant tree species. A second station is situated in the very vicinity outside of the forest (field station, BTF). The meteorological time series are presented in hourly time resolution of air temperature, relative humidity, precipitation, photosynthetically active radiation (PAR) and wind speed. Bettlachstock is part of the Long-term Forest Ecosystem Research Programme (LWF) established and maintained by the Swiss Federal Research Institute WSL.72 years ago
- Location of data collection The Swiss National Park (SNP) is located in the southeastern part of Switzerland, and covers an area of 170 km2, 50 km2 of which is forested, 33 km2 is occupied by alpine and 3 km2 by subalpine grasslands. Elevations range from 1350 to 3170 m a.s.l., and mean annual precipitation and temperature are 871 mm and 0.6°C measured at the Park’s weather station in Buffalora (1980 m a.s.l.) between 1960 and 2009 (MeteoSchweiz 2011). Founded in 1914, the SNP received minimal human disturbance for almost 100 years (no hunting, fishing, or camping, visitors are not allowed to leave the trails). Large (> 1 ha) homogeneous patches of short- and tall-grass vegetation characterize the subalpine grasslands. The average vegetation height of short-grass vegetation is 2 to 5 cm. Red fescue (Festuca rubra L.), quaking grass (Briza media L.) and common bent grass (Agrostis tenuis Sipthrob) are the predominating plant species in this vegetation type. Tussocks of evergreen sedge (Carex sempervirens Vill.) and mat grass (Nardus stricta L.) are predominant in the tall-grass vegetation, which averages 20 cm in vegetation height (Schütz and others 2006). Short-grass vegetation developed in areas where cattle and sheep rested (high nutrient input) during agricultural land-use (from 14th century until 1914); tall-grass vegetation developed in areas where cattle and sheep used to graze, but did not rest (Schütz and others 2003, 2006). Herbivores were shown to consume > 60% of the biomass in short-grass compared to < 20% in tall-grass vegetation (Schütz and others 2006). The herbivore community present in the SNP can be divided into four groups based on body size/weight: large [red deer (Cervus elaphus L.) and chamois (Rupricapra rupricapra L.); 30 - 150 kg], medium [marmot (Marmota marmota L.) and snow hare (Lepus timidus L.); 3 – 6 kg], and small vertebrate herbivores (small rodents: e.g. Clethrionomys spp., Microtus spp., Apodemus spp.; 30 – 100 g) as well as invertebrates (e.g. grasshoppers, caterpillars, cicadas, < 5 g). Experimental design We selected 18 subalpine grassland sites (9 short-grass, 9 tall-grass vegetation). The sites were spread across the entire park on dolomite parent material at altitudes of 1975 to 2300 meters. At each site we established an exclosure network (fences) in spring 2009 (early June), immediately after snowmelt. Each exclosure network consisted of a total of five 2 × 3 m sized plots that progressively excluded the different herbivores listed above (further labeled according to the herbivore guilds that had access to the respective plots “All”, “Marmot/Mice/Invertebrates”, “Mice/Invertebrates”, “Invertebrates”, “None”). The “All” treatment was thus accessible to all herbivores, was not fenced and was located at least 5 m away from a 2.1 m tall and 7 × 9 m main fence that enclosed the other four treatments. This fence was constructed of 10 × 10 cm wooden posts and electrical equestrian tape (AGRARO ECO, Landi, Bern, Switzerland; 20 mm width) mounted at 0.7 m, 0.95 m, 1.2 m, 1.5 m and 2.1 m above the ground that were connected to a solar charged battery (AGRARO Sunpower S250, Landi, Bern, Switzerland). We also mounted non-electrically charged equestrian tape at 0.5 m to help exclude deer and chamois, yet allow marmots and hares to enter safely. Within each main fenced area we randomly established four 2 × 3 m plots: (1) The “Marmot/Mice/Invertebrates” plot remained unfenced, thus, with the exception of red deer and chamois, all herbivores were able to access the plot, (2) The “Mice/Invertebrates” plot consisted of a 90 cm high electric sheep fence (AGRARO Weidezaunnetz ECO, Landi, Bern, Switzerland; mesh size 10 × 10 cm) connected to the solar panel and excluded all medium sized mammals (marmots, hares), but provided access for small mammals and invertebrates, (3) The “Invertebrates” plot provided access for invertebrates only and was surrounded by 1 m high metal mesh (Hortima AG, Hausen, Schweiz; mesh size 2 × 2 cm), (4) The “None” plot was surrounded by a 1 m tall mosquito net (Sala Ferramenta AG, Biasca, Switzerland; mesh size 1.5 × 2 mm) to exclude all herbivores. This plot was covered with a roof constructed of a wooden frame lined with mosquito mesh that was mounted on the wooden corner posts. We also treated this plot with a biocompatible insecticide (Clean kill original, Eco Belle GmbH, Waldshut-Tiengen, Germany) when needed to remove insects that might have entered during data collection or that hatched from the soil. !!! The here published data set only contains data for “All”, and “Marmot/Mice/Invertebrates” (= ungulates excluded) plots !!! Data collection In-situ soil CO2 emissions were measured with a PP-Systems SRC-1 soil respiration chamber (closed circuit) attached to a PP-Systems EGM-4 infrared gas analyzer (PP-Systems, Amesbury, MA, USA) on two randomly selected locations on one subplot within each of the 90 plots. For each measurement the soil chamber (15 cm high; 10 cm diameter) was placed on a permanently installed PVC collar (10 cm diameter) driven five centimeters into the soil at the beginning of the study (June 2009). The measurements were conducted between 0900 and 1700 hours every two weeks from early to early September 2009, 2010, 2011 and 2013. Freshly germinated plants growing within the PVC collars were removed prior to each measurement to avoid measuring plant respiration/photosynthesis. The two measurements collected per plot every two weeks were averaged. Please acknowledge the funding of the study: funded by the Swiss National Science Foundation, SNF grant-no 31003A_122009/1 to Anita C. Risch, Martin Schütz and Flurin Filli12 years ago
- Assessment of coarse woody debris on LWF plots using the line intersect method and full count methods on subplots (repetition of the 2005 survey) ### Purpose: ### Assessing the amount of coarse woody debris ### Manual Citation: ### * ForestBiota, 2005. Stand structure assessment including deadwood. EU/ICP Forests Biodiversity Test-Phase (ForestBIOTA). [>>>](http://www.forestbiota.org)12 years ago
- Potential release files and the artificial RAMMS avalanche simulation output files as well as exposure geodataframe for the case study region of Ortner et al. 2022. Furthermore, all the necessary files to run the risk model Climada Avalnache which code is located at https://github.com/CLIMADA-project/climada_papers.12 years ago
- To study the performance of mature Scots pine (_Pinus sylvestris_ L.) under chronic drought conditions in comparison to their immediate physiological response to drought release, a controlled long-term and large-scale irrigation experiment has been set up in 2003. The experiment is located in a xeric mature Scots pine forest in the Pfynwald (46° 18' N, 7° 36' E, 615 m a.s.l.) in one of the driest inner-Alpine valleys of the European Alps, the Valais (mean annual temperature: 9.2°C, annual precipitation sum: 657 mm, both 1961-1990). Tree age is on average 100 years, the top height is 10.8 m and the stand density is 730 stems ha-1 with a basal area of 27.3 m2 ha-1. The forest is described as _Erico Pinetum sylvestris_ and the soil is a shallow pararendzina characterized by low water retention. The experimental site (1.2 ha; 800 trees) is split up into eight plots of 1'000 m2 each. During April-October, irrigation is applied on four randomly selected plots with sprinklers of 1 m height at night using water from an adjacent water channel. The amount of irrigation corresponds to a supplementary rainfall of 700 mm year-1. Trees in the other four plots grow under naturally dry conditions. Soil moisture has been monitored since the beginning of the project at 3 soil depths (10, 20 and 60 cm). The crown condition of each tree is being assessed each year since 2003. Tree measurement data such as diameter at breast height, tree height, and social status were assessed in 2002, 2009 and 2014. The duration of the irrigation experiment is planned for 20 years.72 years ago
- _ENVIDAT NOTE: Data currently unvailable and measures are being taken to recover and restore the data files._ Processed ground temperature measurements at the Ritigraben permafrost borehole (RIT_0102) in canton Valais, Switzerland. The borehole is located at 2690 m asl on a flat site. The surface material is coarse blocks and borehole depth is 30 m. Thermistors used YSI 44006. Year of drilling 2002. This borehole is part of the Swiss Permafrost network, PERMOS (www.permos.ch). Contact phillips@slf.ch for details of processing applied.32 years ago
- # Background information High elevation ecosystems are important in research about environmental change because shifts in climate associated with anthropogenic greenhouse gas emissions are predicted to be more pronounced in these areas compared to most other regions of the world. This project involved a Free Air CO2 Enrichment (FACE) and soil warming experiment located in a natural treeline environment near Davos, Switzerland (Stillberg, 2200 m a.s.l.). Elevated atmospheric CO2 concentrations (+200 ppm) were applied from 2001 until 2009, and a soil warming treatment (+4 °C) was applied from 2007 until 2012. The combined CO2 enrichment and warming treatment reflects conditions expected to occur in this region in approximately 2050. A broad range of ecological and biogeochemical research was carried out as part of this environmental change project. # Experimental design The experiment consisted of 40 hexagonal 1.1 m² plots, 20 with a *Pinus mugo* ssp. *uncinata* (mountain pine, evergreen) individual in the centre and 20 with a *Larix decidua* (European larch, deciduous) individual in the centre. A dense cover of understorey vegetation surrounded the tree in each plot, including the dominant dwarf shrub species *Vaccinium myrtillus* (bilberry), *Vaccinium gaultherioides* (group *V. uliginosum agg.*, northern bilberry) and *Empetrum nigrum* ssp. *hermaphroditum* (crowberry) plus several herbaceous and non-vascular species. At the beginning of the experimental period, the 40 plots were assigned to ten groups of four neighbouring plots (two larch and two pine trees per group) in order to facilitate the logistics of CO2 distribution and regulation. Half of these groups were randomly assigned to an elevated CO2 treatment, while the remaining groups served as controls and received no additional CO2. In spring 2007, one plot of each tree species identity was randomly selected from each of the 10 CO2 treatment groups and assigned a soil warming treatment, yielding a balanced design with a replication of five individual plots for each combination of CO2 level, warming treatment and tree species. # Data description Soil and air conditions have been monitored closely throughout the study period, with most measurements made during the combined CO2 x warming experiment (2007-2009). The data comprise of air temperature, soil temperature, soil moisture, sapflow, tree diameter and CO2 measurements.42 years ago
- This dataset contains measurement and simulation data. The measurements characterize the standard meteorology, turbulence, and snow transport at the S17 site near Syowa Station in East Antarctica during an expedition in austral summer 2018/2019. Large-eddy simulations with sublimating particles provide additional insight into the latent and sensible heat exchange between snow and air in two example situations observed at the S17 site. A part of the measurement data was recorded by an automatic measurement station from 10th January 2019 to 26th January 2019. This measurement station was equipped with standard meteorological sensors, a three-dimensional ultrasonic anemometer, an open-path infrared gas analyzer, a snow particle counter, an infrared radiometer for measurements of the surface temperature, and a sonic ranging sensor measuring changes in snow surface elevation. At a horizontal distance of approximately 500 m, a Micro Rain Radar (MRR) was installed in a tilted configuration with an elevation angle of 7° for remote sensing of blowing snow between 25th December 2018 and 24th January 2019. In addition, near-surface in-situ measurements of snow transport were performed at the location of the MRR by deploying a snow particle counter from 27th December 2018 to 24th January 2019. The simulations cover a 18 x 18 x 6 m³ domain and reproduce the steady-state conditions during a 10-min interval with significant snow transport and another 10-min interval with negligible snow transport. We provide the model source code and the post-processed simulation data, i.e., horizontally averaged quantities as a function of height and time.72 years ago
- We have analysed past transformations in Switzerland in four environmental domains, with the aim to draw conclusions for current challenges, such as the net‐zero transformation. The data comprise transcripts of interviews with experts in the field of biodiversity, forests, landscape and natural hazard research.12 years ago
- Dry weight (mass) of the needles and leaves of the living trees and shrubs starting at 12 cm dbh. __Citation:__ > _Abegg, M.; Brändli, U.-B.; Cioldi, F.; Fischer, C.; Herold-Bonardi, A.; Huber M.; Keller, M.; Meile, R.; Rösler, E.; Speich, S.; Traub, B.; Vidondo, B. (2014). Fourth national forest inventory - result tables and maps on the Internet for the NFI 2009-2013 (NFI4b). [Published online 06.11.2014] Available from World Wide Web http://www.lfi.ch/resultate/ Birmensdorf, Swiss Federal Research Institute WSL. [doi:10.21258/1057112](https://doi.org/10.21258/1057112)_22 years ago
- The population dynamics of eruptive moths were monitored with pheromone traps and the composition of the larvae's foodplants were analyzed for water content, nitrogen and total phenolics. Moth catches cover a period of 20 years, leaf analyses 10 years. For Zeiraphera griseana (= Z. diniana) only needle analyses are available. The corresponding data on the moth population dynamics are property of A. Fischlin, ETH Zürich, and will be made available on EnviDat as well.12 years ago
- Fine-root traits of Scots pine in response to enhanced soil water availability deriving from long-term irrigation in the Pfynwald Data_Fig.1.xlsx Fine-root biomass of the topsoil (0-10 cm) in the dry and irrigated treatment of the Scots pine forest of the years 2003 to 2016 recorded by soil coring Data_Tab1+2_2005.xlsx Fine-root traits from roots of ingrowth cores from 2005 after two years of growth in the dry and irrigated treatment of the Scots pine forest Data_Tab1+2_2016.xlsx Fine-root traits from roots of ingrowth cores from 2016 after two years of growth, and from roots of the soil-coring sampling from 2016 in the dry and irrigated treatment of the Scots pine forest12 years ago
-  LWF Plot Celerina - Community: Celerina / canton GR - Date of installation: 3 July 1996 - Size of the plot: 2 ha - Altitude (m): 1846-1896 - Mean slope: 34% - Geology (in German): Untergrund: ostalpin; prätriadische Tiefengesteine - Oberfläche: Quartär; karbonatfreie Moräne - Soil types (WSL): n.d. - Woodland association after EK72: 59: Larici-Pinetum cembrae - Main tree species: Pinus cembra - Management system: high forest - Silvicultural system: group selection - Top-height diameter (quadratic average diameter of the 100 thickest trees per ha): 48.6 cm - Number of trees BHD >= 12 cm (2011): 469 - Maximum tree age: Pinus cembra uneven-aged - 210-250 years More Information: https://www.wsl.ch/en/forest/forest-development-and-monitoring/long-term-forest-ecosystem-research-lwf/sites/celerina.html22 years ago
- Processed ground temperature measurements at the Fluelapass permafrost borehole A (FLU_0102) in canton Graubunden, Switzerland. The borehole is located at 2394 m asl on a moderate (26°) North-east slope (45°). The surface material is talus and borehole depth is 23 m. Thermistors used YSI 44006. Year of drilling 2002. This borehole is part of the Swiss Permafrost network, PERMOS (www.permos.ch). Contact phillips@slf.ch for details of processing applied.32 years ago
- Volume of stemwood with bark of all trees and shrubs starting at 12 cm dbh that were felled between two inventories. The correction for bias with the sample Tarif trees may be so drastic that it results in negative values with small numbers of trees. __Citation:__ > _Abegg, M.; Brändli, U.-B.; Cioldi, F.; Fischer, C.; Herold-Bonardi, A.; Huber M.; Keller, M.; Meile, R.; Rösler, E.; Speich, S.; Traub, B.; Vidondo, B. (2014). Fourth national forest inventory - result tables and maps on the Internet for the NFI 2009-2013 (NFI4b). [Published online 06.11.2014] Available from World Wide Web http://www.lfi.ch/resultate/ Birmensdorf, Swiss Federal Research Institute WSL. [doi:10.21258/1057112](https://doi.org/10.21258/1057112)_22 years ago
- Wood volume of the stem without bark or stump at least 7 cm in diameter (limit of coarse wood) of all trees and shrubs starting at 12 cm dbh, based on the stem-form functions according to Kaufmann (2001). The definition of the assortment is based on the 2000 edition of the Trading Practices (Handelsgebräuchen Ausgabe 2000 ). __Citation:__ > _Abegg, M.; Brändli, U.-B.; Cioldi, F.; Fischer, C.; Herold-Bonardi, A.; Huber M.; Keller, M.; Meile, R.; Rösler, E.; Speich, S.; Traub, B.; Vidondo, B. (2014). Fourth national forest inventory - result tables and maps on the Internet for the NFI 2009-2013 (NFI4b). [Published online 06.11.2014] Available from World Wide Web http://www.lfi.ch/resultate/ Birmensdorf, Swiss Federal Research Institute WSL. [doi:10.21258/1057112](https://doi.org/10.21258/1057112)_12 years ago
- This report presents past observations and projects the future development of water temperature in Swiss lakes and rivers. Projections are made until the end of the 21st century using the CH2018 climate scenarios. Besides climate change effects on temperature, we also discuss effects on discharge for rivers, and effects on the thermal structure, and specifically the seasonal mixing regime and ice cover of lakes.12 years ago
- This data set provides soil organic carbon, total nitrogen, and stable carbon isotope (13C) values of mineral soil (0-45cm), organic horizons (Oi, Oe, Oa), and root biomass of an afforestation sequence (0-130years) on a subalpine pasture in Jaun, Switzerland.12 years ago
- License: GPL-v2 The R script presents an advanced sampling approach for monitoring biodiversity on agricultural land by combining multiple objectives and integrating environmental and geographic space. The example demonstrates the first-stage selection of squares (km2) in the ALL-EMA sampling design using modern sampling techniques such as unequal probability sampling with fixed sample size, balanced sampling, stratified balancing and geographic spreading. Sampling is done with unequal probabilities and weights defined by power allocation to give equal weight to extrapolations to the total agricultural area of Switzerland and two stratifications of predefined interest (regions and agricultural production zones). Calibration is used to limit the distribution of the sampling weights. The sample sizes are almost fixed within the strata and evenly distributed across the years of a temporal rotation plan, which is favourable for the organisation of the field survey. Sampling also ensures an optimal (annual) distribution across geographic space, including altitude. Despite the complexity of the sampling, estimation based on probability theory is straightforward. Ecker, K.T., Meier, E.S. & Tillé, Y. 2023. Integrating spatial and ecological information into comprehensive biodiversity monitoring on agricultural land. Environmental Monitoring and Assessment 195.22 years ago
- Dataset of manual bi-weekly snow profiles from Weissfluhjoch, Davos, Switzerland. Typical snow profile measurements and observations are included (temperature, density, grain size, grain type, hardness, wetness), following the guidelines of the The International Classification for Seasonal Snow on the Ground (ICSSG) [Fierz, C., Armstrong, R.L., Durand, Y., Etchevers, P., Greene, E., McClung, D.M., Nishimura, K., Satyawali, P.K. and Sokratov, S.A. 2009. The International Classification for Seasonal Snow on the Ground. IHP-VII Technical Documents in Hydrology N°83, IACS Contribution N°1, UNESCO-IHP, Paris].22 years ago
- Attention: this data is not updated after 2022 anymore. This dataset contains the statistics on the number of avalanche fatalities per hydrological year in Switzerland. The data set commences with the beginning of the hydrological year 1936/37 on 01/10/1936. After the completion of a hydrological year, the new data is appended to the existing dataset. The following information is contained (by column and column title): - hydrological year - number of fatalities in the backcountry (=tour) - number of fatalities in terrain close to ski areas (=offpiste) - number of fatalities on transportation corridors including ski runs, roads, railway lines (=transportation.corridors) - number of fatalities in or around buildings or in settlements (= buildings) - sum (of all four categories) The definition for these four categories as described in the guidelines to the avalanche accident database: **tour**: activities include back-country ski, snowboard or snow-shoe touring **offpiste**: access from ski area, generally from the top of a skilift with short hiking distances **transportation.corridors** ([Techel et al., 2016](http://www.geogr-helv.net/71/147/2016/ )): people travelling or recreating on open or temporarily closed transportation corridors (e.g. a road user or a skier on a ski run) and people working on open or closed transportation corridors (e.g. maintenance crews on roads, professional rescue teams) **buildings** ([Techel et al., 2016](http://www.geogr-helv.net/71/147/2016/ )): people inside or just outside buildings, and workers on high alpine building sites12 years ago
- The wind-driven saltation of sand and snow shapes dunes and ripples, generates dust emission, and erodes the surface of the Antarctic ice sheet. Here, we use a model based on the discrete element method to simulate grain-flow interactions and study the effect of particle cohesion on saltation dynamics. The data contains the model output of granular splash simulations and saltation simulations. Granular splash, the main particle entrainment process in saltation, occurs upon impact of saltating particles with the granular bed. We performed Monte Carlo simulations of granular splash for loose sand grains and for cohesive ice grains. The analysis indicate that different values of cohesion have significant effects not on the number of splashed grains, on the ejection velocity, and the rebound velocity. In our saltation simulations, we trigger particle movement with a single splash event at the inlet section section and let the system evolve until steady state. Our results show that saltation over cohesive surfaces is difficult to initiate but easy to sustain at low wind speed. The occurrence of transport thus depends on the history of the wind speed, a phenomenon known as hysteresis. We also show that saltation over cohesive surfaces presents higher mass fluxes but requires longer distances to saturate, which increases the size of the smallest stable surface ripples. Our model results have implications for large-scale aeolian processes on Earth and Titan, where sand grains are thought to be very cohesive.12 years ago
- This data set includes synchronized and independently measured water discharge, bedload transport and at-a-point bedrock erosion data in 1 minute resolution and over more than 1.5 years from the Erlenbach stream hydrological observatory, a small (first-order) catchment in the pre-alpine valley Alptal in central Switzerland. These measurements are of high accuracy, which have been assessed in Beer, A.R. et al. 2015. Earth Surf. Proc., 40, 530-541. doi: 10.1002/esp.3652. For the artificial bedrock (a slab of weak concrete, fixed flush with the streambed) 6 additional consecutive spatial elevation data sets of 1 mm resolution have been surveyed that allow the local continuous erosion measurements to be extended to the patch scale. This unique data set has been used to validate and calibrate bedrock erosion models for the process to intermediate scales of time (and space), whose performance then was assessed over extended time (up to bicentennial floods), based on available longer data sets of linked discharge and bedload transport (see related datasets).22 years ago
- Wood volume of the stem (without bark and stump) and the branches (with bark) at least 7 cm in diameter (limit for coarse wood) from trees and shrubs starting at 12 cm dbh that were living in the pre-inventory and were cut between the two inventories. __Citation:__ > _Abegg, M.; Brändli, U.-B.; Cioldi, F.; Fischer, C.; Herold-Bonardi, A.; Huber M.; Keller, M.; Meile, R.; Rösler, E.; Speich, S.; Traub, B.; Vidondo, B. (2014). Fourth national forest inventory - result tables and maps on the Internet for the NFI 2009-2013 (NFI4b). [Published online 06.11.2014] Available from World Wide Web http://www.lfi.ch/resultate/ Birmensdorf, Swiss Federal Research Institute WSL. [doi:10.21258/1057112](https://doi.org/10.21258/1057112)_22 years ago
- Groundwater time series between 2010 and 2014 of the distributed monitoring system in the Studibach (C7), Alptal, Switzerland. Data published in Rinderer M., van Meerveld I, McGlynn B. (2019): From points to patterns – Assessing runoff source area dynamics and hydrological connectivity using time series clustering. Water Resources Research, doi: 2018WR023886R12 years ago
- Data on: (1) spatial distribution of urban beekeeping (number of hives and number of beekeeping locations) in 14 Swiss cities (Geneva, Lausanne, Biel, Neuchatel, Basel, Zurich, Chur, Luzern, St. Gallen, Winterthur, Bern, Lugano, Bellinzona, Thun) for the period 2012-2018; (2) aggregated data to model the sustainability of urban beekeeping.32 years ago
- During the last 45 years, about 100 people lost their lives in avalanches in the European Alps each year. Avalanche fatalities in settlements and on transportation corridors have considerably decreased since the 1970s. In contrast, the number of avalanche fatalities during recreational activities away from avalanche-secured terrain doubled between the 1960s and 1980s and has remained relatively stable since, despite a continuing strong increase in winter backcountry recreational activities. Data complementing Figure 2 in: _"Avalanche fatalities in the European Alps: long-term trends and statistics"_, by Techel, F., Jarry, F., Kronthaler, G., Mitterer, S., Nairz, P., Pavšek, M., Valt, M., and Darms, G. Data description: please refer to section 2 (Data and Methods) in the mentioned publication12 years ago
- **We used Swiss National Forest Inventory ([NFI](https://www.lfi.ch/index-en.php)) data to model the potential distribution of the most common woody species for the forested area of Switzerland and provide potential distribution maps that fulfill specific quality criteria with regard to predicting performance.** More details on the methods and results are described in the project summary available [here](https://www.envidat.ch/dataset/07a9c22c-9ec2-4f49-87e2-3b2d73ad81f2/resource/9bfd5308-d9be-4d01-ab78-48d33889e04e/download/mogli_summary.pdf). **The resulting maps can be viewed in a simple web-GIS application available at:** [https://www.lfi.ch/produkte/mogli/mogli-en.php](https://www.lfi.ch/produkte/mogli/mogli-en.php) **Data can be used without restrictions, but the data must be explicitly asked from the contact person of the dataset in order to obtain access.** This is a requirement to fulfill the needs of reporting towards the funding agencies.52 years ago
- Total water reserves of the snow cover [mio m3] for Wägital catchment, Switzerland, for reference date April 1. Data is separated in 2 elevation zones 900m-1500m asl and 1500m-2300m asl. Time period 1943-2023, status 2023-04-17. Funded currently or in the past by: - Federal Office of Meteorology and Climatology MeteoSwiss in the context of GCOS Switzerland - Meteodat GmbH - Institute of Geography, University of Zurich - WSL Institute for Snow and Avalanche Research SLF - Institute of Geography, ETH Zurich (IAC ETH Zurich) - AG Kraftwerk Wägital (AXPO and EWZ) See also https://www.meteodat.ch/waegital.html22 years ago
- This data set contains the data presented in the figures 1-6 in Walthert et al. (2020): From the comfort zone to crown dieback: sequence of physiological stress thresholds in mature European beech trees across progressive drought. Science of the Total Environment. DOI: 10.1016/j.scitotenv.2020.141792. A detailed methodical description of the data can be found in the Material and Methods section of the paper. Drought responses of mature trees are still poorly understood making it difficult to predict species distributions under a warmer climate. Using mature European beech (Fagus sylvatica L.), a widespread and economically important tree species in Europe, we aimed at developing an empirical stress-level scheme to describe its physiological response to drought. We analysed effects of decreasing soil and leaf water potential on soil water uptake, stem radius, native embolism, early defoliation and crown dieback with comprehensive measurements from overall nine hydrologically distinct beech stands across Switzerland, including records from the exceptional 2018 drought and the 2019/2020 post-drought period. Based on the observed responses to decreasing water potential we derived the following five stress levels: I (predawn leaf water potential >-0.4 MPa): no detectable hydraulic limitations; II (-0.4 to -1.3): persistent stem shrinkage begins and growth ceases; III (-1.3 to -2.1): onset of native embolism and defoliation; IV (-2.1 to -2.8): onset of crown dieback; V (<-2.8): transpiration ceases and crown dieback is >20%. Our scheme provides, for the first time, quantitative thresholds regarding the physiological downregulation of mature European beech trees under drought and therefore synthesises relevant and fundamental information for process-based species distribution models. Moreover, our study revealed that European beech is drought vulnerable, because it still transpires considerably at high levels of embolism and because defoliation occurs rather as a result of embolism than preventing embolism. During the 2018 drought, an exposure to the stress levels III-V of only one month was long enough to trigger substantial crown dieback in beech trees on shallow soils. On deep soils with a high water holding capacity, in contrast, water reserves in deep soil layers prevented drought stress in beech trees. This emphasises the importance to include local data on soil water availability when predicting the future distribution of European beech.12 years ago
- What are the research data files about: Raw data on perfomance (dry weight, development and mortality) of emerald ash borer larvae used in published bioassays. Raw data on ash dieback leasion lenghts. Raw data on untargeted and targeted specialized ash metabolites. Which methods were used: Bioassays in greenhouses and climate chambers to collect data on emerald ash borer and ash dieback perfomance. Phytochemical analyses on ash phloem for quantifiying specialized metabolites. When and where was the data created / extracted: Summer 2020-202112 years ago
- This dataset contains all data on which the following publication below is based. Paper Citation: Risch, A.C., Frossard, A., Schütz, M., Frey, B., Morris, A.W., Bump, J.K. (accepted) Effects of elk and bison carcasses on soil microbial communities and ecosystem functions in Yellowstone, USA. (accepted). Functional Ecology doi: ... Methods Study area and study sites This study was conducted in YNP’s Northern Range (NR), located in north-western Wyoming and south-western Montana, USA (~44.9163° N, 110.4169° W). The NR expands over ~1000 km2 and features long cold winters and short dry summers. Grasslands and shrublands dominate the NR that is the home of large migratory herds of bison (winter counts 2017: ~3919 individuals; Geremia, Wallen, & White, 2017) and elk (~5349 individuals) as well as their main predators, approximately five packs of wolves with a total of 33 individuals (Smith et al., 2017). As part of a long-term research program within YNP, wolf predation has been studied since their reintroduction in 1995. For our study, we received ground-truthed coordinates of bison and elk carcasses from winter 2016/17 (November 2016 through April 2017) from the YNP Wolf Project. Between June 20 and July 1, 2017, we visited 24 carcasses in total. At five sites, we could not sample as the carcasses were no longer found. In total we located remains (hairmats, rumen content, bones, teeth) of 19 adult male and female carcasses (7 bison, 12 elk; Supplementary Table 1). Live body weights of adult bison and elk are approximately 730 kg (male bison), 450 kg (female bison), 330 kg (male elk), and 235 kg (female elk, Meagher, 1973; Quimby & Johnson, 1951). The kills and subsequent consumption happened between 34 and 173 days prior to our sampling (hereafter “days since kill”, DSK), for which we accounted in our statistics. Note that wolves and other scavengers consumed the soft tissue of the carcasses quickly, hence, there is close to no soft tissue left for decomposition as compared to an intact body left on the soil surface. The 19 carcass sites covered the extent of YNP’s NR, with both bison and elk carcasses showing similar distributions; elevation ranged from 1703 to 2884 m a.s.l. (Supplementary Fig 1 & Supplementary Table 1). The carcasses were all located in grassland or sage-brush shrubland, with or without sparsely scattered trees, and both bison and elk carcasses showed the same distribution of DSK. At each study site, we selected a reference plot (hereafter “control”) that was of comparable size, slope aspect and vegetation to the carcass location (hereafter “carcass”). The control was at least 10 m away (Danell, Berteaux, & Brathen, 2002; Melis et al., 2007) from the carcass itself to ensure the absence of potential direct and indirect carcass effects (paired design; (Bump, Webster, et al., 2009; Bump, Peterson, et al., 2009). Ecosystem functions and soil properties We randomly collected 50 g of mineral soil from three locations on both control and carcass plots to a depth of 5 cm with sterile techniques and gently mixed the material to obtain a composite sample. Half the soil sample was immediately bagged in plastic bags (whirl packs), stored in a cooler with ice packs (~5 ºC), sieved (2-mm) and frozen within 4-6 hours of collection to assess soil microbial communities. For this purpose, we extracted total genomic DNA from 0.5 g soil using the PowerSoil DNA Isolation Kit (Qiagen, Hilden, Germany). DNA concentrations were measured using PicoGreen (Molecular Probes, Eugene, OR, USA). PCR amplifications of partial bacterial small-subunit ribosomal RNA genes (region V3–V4 of 16S rRNA) and fungal ribosomal internal transcribed spacers (region ITS2) were performed as described previously (Frey et al., 2016). Each sample consisting of 40 ng DNA was amplified in triplicate and pooled before purification with Agencourt AMPure XP beads (Beckman Colter, Berea, CA, USA) and quantified with the Qubit 2.0 fluorometric system (Life Technologies, Paisley, UK). Amplicons were sent to the Genome Quebec Innovation Center (Montreal, Canada) for barcoding using the Fluidigm Access Array technology and paired-end sequencing on the Illumina MiSeq v3 platform (Illumina Inc., San Diego, CA, USA). Quality control of bacterial and fungal reads was performed using a customized pipeline (Supplementary Table 2; Frey et al., 2016). Paired-ends reads were matched with USEARCH (Edgar & Flyvbjerg, 2015), substitution errors were corrected using Bayeshammer (Nikolenko, Korobeynikov, & Alekseyev, 2013) and PCR primers were trimmed (allowing for 1 mismatch, read length >300 bp for 16S and >200 bp for ITS primers) using Cutadapt (M. Martin, 2011). Sequences were dereplicated and singleton reads removed prior to clustering into operational taxonomic units (OTUs) at 97% identity using USEARCH (Edgar, 2013). The remaining centroid sequences were tested for the presence of ribosomal signatures using Metaxa2 (Bengtsson-Palme et al., 2015) or ITSx (Bengtsson-Palme et al., 2013). Taxonomic assignments of the OTUs were obtained using Bayesian classifier (Wang, Garrity, Tiedje, & Cole, 2007) with a minimum bootstrap support of 60% implemented in mothur (Schloss et al., 2009) by querying the bacterial and fungal reads against the SILVA Release 128 (Quast et al., 2013) and UNITE 8.0 (Abarenkov et al., 2010) reference databases for 16S and ITS OTUs, respectively. Abundances of the bacterial 16S rRNA gene and fungal ITS amplicon were determined by quantitative real-time PCR (qPCR) on an ABI7500 Fast Real-Time PCR system (Applied Biosystems, Foster City, CA, USA) as described previously (Frossard et al., 2018). The same primers (without barcodes) and cycling conditions as for the sequencing approach were used for the 16S and ITS qPCR. Three standard curves per target region were obtained using tenfold serial dilutions of plasmids generated from cloned targets (Frey, Niklaus, Kremer, Lüscher, & Zimmermann, 2011). Data were converted to represent mean copy number of targets per gram of soil (dry weight). The other half of the soil sample was bagged in paper, dried to constant weight at 60°C, passed through a 2 mm sieve and analyzed for total C and N concentration with a CE Instruments NC 2100 soil analyzer (CE Elantech Inc., Lakewood NJ, USA). We also collected 20 mature and undamaged leaves of the dominant grass species growing on control and carcass sites, but taxa were not recorded. The plant material was dried at 60°C, finely ground till homogenized and also analyzed to obtain total C and N concentrations. Soil temperature (10 cm depth) was measured with a waterproof digital thermometer (Barnstead International, Dubuque IA, USA) at three locations each at the control and carcass site. Soil moisture (0 – 10 cm depth) was measured with time domain reflectometry (Field-Scout TDR-100; Spectrum Technologies, Plainfield IL, USA) at five randomly chosen points on control and carcass sites. We measured soil respiration at five randomly chosen points at both control and carcass sites with a PP-Systems SRC-1 soil respiration chamber (closed circuit) attached to a PP-Systems EGM-4 infrared gas analyzer (PP-Systems, Amesbury, MA, USA). For each measurement the soil chamber (15 cm high; 10 cm diameter) was tightly placed on the soil surface, after clipping plants to avoid measuring plant respiration or photosynthesis. Measurements were conducted over 120 s. In addition, we assessed the decomposition rates of standardized OM using the cotton strip assay (Latter & Howson, 1977; Latter & Walton, 1988). Cotton cloth tensile strength loss (CTSL) is a measure of decomposition, and an index to express the combined effect of soil microclimatic, physical, chemical and biological properties on decomposition while accounting for OM quality (Latter & Walton, 1988; Risch, Jurgensen, & Frank, 2007; Withington & Sanford Jr., 2007). We placed five 20 cm wide x 13 cm long sheets of 100% unbleached cotton cloth (American Type SM 1/18’’, Warp: 34/1, Weft: 20/1, Weave plain, 29.5 picks/cm warp, 22 picks/cm weft, 237 g/m2; Daniel Jenny & Co., Switzerland;) at each carcass and control site vertically into the soil by making slits with a flat spade to a depth of 12 cm. We inserted each cloth with the spade, and then pushed the slit closed to assure tight contact with the soil. The cloths were retrieved after 18 to 27 days. After retrieval, the cloths were air-dried, remaining soil gently removed by hand, and 1.5 cm wide strips were cut at the 3.5-5.0 cm (top) and the 9-10.5 cm (bottom) soil depth. The strips were equilibrated at 50 % relative humidity and 20°C for 48 hours (climate chamber) prior to strength testing (Scanpro Awetron TH-1 tensile strength tester; AB Lorentzen and Wettre, Kista, Sweden). Cotton rotting rate (CRR) = (CTScontrol - CTSfinal/CTSfinal)1/3 * (365/t), where CTScontrol is the cotton tensile strength of a control cloth and CTSfinal the cotton tensile strength of the incubated sample, t is the incubation period in days. Control cloths were inserted into the ground and immediately retrieved to account for tensile strength loss associated with cloth insertion. We averaged the CRR of top and bottom strips for further analyses as no difference was found between the two. All sampling and cloth insertion took place between June 20 and July 1, 2017, cloths were retrieved between July 17 and 20, 2017. Soil respiration, average CRR, vegetation N concentration and vegetation C:N ratio are defined as ecosystem functions, soil C and N concentration, soil temperature and moisture as soil abiotic properties, and bacterial and fungal richness (number of taxa), diversity (Shannon) and abundance as soil biotic properties. Statistical analyses Univariate analyses for ecosystem functions, soil biotic and abiotic properties We tested whether individual ecosystem functions, soil biotic and abiotic properties differed between carcass and control (“Location”), bison and elk (“Species”) and days since kill (“DSK”). For this purpose, we used linear mixed effect models (LMM, “nlme” package v 3.1 – 131.1 in R v 3.4.4; Pinheiro, Bates, DebRoy, & Sarkar, 2018; R Core Team, 2019) with Location, Species, Location x Species and DSK as fixed effects. Site was included as random effect to account for the paired design. We developed a separate model for all dependent variables. All but bacterial richness, fungal richness, fungal diversity and vegetation N concentration were natural-log transformed to meet model assumptions. For each LMM, we calculated contrasts to assess the specific comparisons we were interested in with the “lsmeans” package v 2.27-62 (Lenth & Love, 2018): 1) carcass vs control, 2) carcass bison vs control bison, and 3) carcass elk vs control elk. We also tested whether we had differences between bison and elk carcasses or the sites where bison and elk were killed and included contrasts 4) carcass bison vs carcass elk and 5) control bison vs control elk. We calculated the log response ratio (LRR = ln[carcass/control]) to obtain carcass effects for all variables for both species separately. LRR < 0 indicates higher value at control compared to carcass, LRR > 0 indicates higher values at carcass compared control. We used LRRs for visualization and to assess spatial patterns in carcass effects across YNP. For this purpose we calculated the Moran’s I statistic for each ecosystem function, soil biotic and abiotic property based on a latitude-longitude matrix with the “moran.test” function in the “spdep” package version 1.1-3 (Bivand et al., 2019). Multivariate analyses Rare OTUs, defined as OTUs with a low abundance of reads, were retained in multivariate methods because they only marginally influence these analyses (Gobet, Quince, & Ramette, 2010). Bray–Curtis dissimilarity matrices were generated based on square-root-transformed matrices. We used Principal Coordinate Analyses (PCoA) to assess how soil bacterial and fungal communities differed between control and carcass of bison and elk (“vegan” package v 2.5-4, Oksanen et al., 2019). We then extracted PCoA axes scores 1 and 2 and used LMM (“nlme” package) with Location, Species, Location x Species and DSK as fixed effects. Site was, again, included as random effect. We again calculated the contrasts as described above using the “lsmeans” package. We also assessed how ecosystem functions, and soil abiotic and biotic properties were related to the soil bacteria and fungi community structure associated with bison and elk control and carcasses using the “envfit” function in the “vegan” package (Oksanen et al., 2019). Indicator species analyses were performed using the multipatt function implemented in the “indicspecies” package version 1.7.6 with 100000 permutations (De Caceres & Jansen, 2016). This step allowed to identify OTUs that led to changes in multivariate patterns between control and carcass of both bison and elk separately (De Cáceres, Legendre, & Moretti, 2010). The multipatt function uses a point biserial correlation coefficient statistical test. Indicator OTUs were defined as bacterial and fungal OTUs with more than 50 sequences, i.e., removing rare taxa and taxa with low abundances containing little indicator information (Rime et al., 2015) and that were significantly correlated with Location (p < 0.05, correlation coefficient > 0.3). A heatmap of these OTUs were generated with the vegan and ggplot2 packages. The indicator analyses were performed in R version 3.3.3 (R Core Team, 2017). References Abarenkov, K., Henrik Nilsson, R., Larsson, K.-H., Alexander, I. J., Eberhardt, U., Erland, S., … Kõljalg, U. (2010). The UNITE database for molecular identification of fungi – recent updates and future perspectives. New Phytologist, 186(2), 281–285. doi:10.1111/j.1469-8137.2009.03160.x Bengtsson-Palme, J., Hartmann, M., Eriksson, K. M., Pal, C., Thorell, K., Larsson, D. G. J., & Nilsson, R. H. (2015). metaxa2: improved identification and taxonomic classification of small and large subunit rRNA in metagenomic data. Molecular Ecology Resources, 15(6), 1403–1414. doi:10.1111/1755-0998.12399 Bengtsson-Palme, J., Ryberg, M., Hartmann, M., Branco, S., Wang, Z., Godhe, A., … Nilsson, R. H. (2013). Improved software detection and extraction of ITS1 and ITS2 from ribosomal ITS sequences of fungi and other eukaryotes for analysis of environmental sequencing data. Methods in Ecology and Evolution, 4(10), 914–919. doi:10.1111/2041-210X.12073 Bivand, R., Altman, M., Anselin, L., Assuncao, R., Berke, O., Blanchet, G., … Yu, D. (2019). spdep: Spatial dependence, weighthing schemes, statistics. R package version 1.1-3. Bump, J. K., Peterson, R. O., & Vucetich, J. A. (2009). Wolves modulate soil nutrient heterogeneity and foliar nitrogen by configuring the distribution of ungulate carcasses. Ecology, 90(11), 3159–3167. Bump, J. K., Webster, C. R., Vucetich, J. A., Peterson, R. O., Shields, J. M., & Powers, M. D. (2009). Ungulate carcasses perforate ecological filters and create biogeochemical hotspots in forest herbaceous layers allowing trees a competitive advantage. Ecosystems, 12(6), 996–1007. doi:10.1007/s10021-009-9274-0 Danell, K., Berteaux, D., & Brathen, K. A. (2002). Effect of muskox carcasses on nitrogen concentration in tundra vegetation. Arctic, 55(4), 389392. De Caceres, M., & Jansen, F. (2016). indicspecies: relationship between species and groups of species. R package version 1.7.6. De Cáceres, M., Legendre, P., & Moretti, M. (2010). Improving indicator species analysis by combining groups of sites. Oikos, 119(10), 1674–1684. doi:10.1111/j.1600-0706.2010.18334.x Edgar, R. C. (2013). UPARSE: highly accurate OTU sequences from microbial amplicon reads. Nature Methods, 10, 996. Edgar, R. C., & Flyvbjerg, H. (2015). Error filtering, pair assembly and error correction for next-generation sequencing reads. Bioinformatics, 31(21), 3476–3482. doi:10.1093/bioinformatics/btv401 Frey, B., Niklaus, P. A., Kremer, J., Lüscher, P., & Zimmermann, S. (2011). Heavy-machinery traffic impacts methane emissions as well as methanogen abundance and community structure in oxic forest soils. Applied and Environmental Microbiology, 77(17), 6060–6068. doi:10.1128/AEM.05206-11 Frey, B., Rime, T., Phillips, M., Stierli, B., Hajdas, I., Widmer, F., & Hartmann, M. (2016). Microbial diversity in European alpine permafrost and active layers. FEMS Microbial Ecology, 92(3), fiw018. Frossard, A., Donhauser, J., Mestrot, A., Gygax, S., Bååth, E., & Frey, B. (2018). Long- and short-term effects of mercury pollution on the soil microbiome. Soil Biology and Biochemistry, 120, 191–199. doi:https://doi.org/10.1016/j.soilbio.2018.01.028 Geremia, C., Wallen, R., & White, P. J. (2017). Status report of the Yellowstone bison population, September 2017. Yellowstone National Park, Mammoth, WY, USA: National Park Service, Yellowstone Center for Resources. Gobet, A., Quince, C., & Ramette, A. (2010). Multivariate cutoff level analysis (MultiCoLA) of large community data sets. Nucleic Acids Research, 38(15), e155–e155. doi:10.1093/nar/gkq545 Latter, P., & Howson, G. (1977). The use of cotton strips to indicate cellulose decomposition in the field. Pedobiologia, (17), 145–155. Latter, P., & Walton, D. (1988). The cotton strip assay for cellulose decomposition studies in soil: history of the assay and development. In Cotton strip assay: an index for decomposition in soils (pp. 7–9). ITE Symposium, Institute of Terrestrial Ecology, Natural Environment Research Council, UK. Lenth, R., & Love, J. (2018). lsmeans: least-squares means. R package version 2.27-62. Martin, M. (2011). Cutadapt removes adapter sequences from high-throughput sequencing reads. EMBnet.Journal, 17(1), 10–12. Meagher, M. M. (1973). The bison of Yellowstone National Park. NPS Scientific Monograph (Vol. 1). National Park Service, Yellowstone Center for Resources. Melis, C., Selva, N., Teurlings, I., Skarpe, C., Linnell, J. D. C., & Andersen, R. (2007). Soil and vegetation nutrient response to bison carcasses in Białowieża Primeval Forest, Poland. Ecological Research, 22(5), 807–813. doi:10.1007/s11284-006-0321-4 Nikolenko, S. I., Korobeynikov, A. I., & Alekseyev, M. A. (2013). BayesHammer: Bayesian clustering for error correction in single-cell sequencing. BMC Genomics, 14(1), S7. doi:10.1186/1471-2164-14-S1-S7 Oksanen, J., Blanchet, F. G., Friendly, M., Kindt, R., Legendre, P., McGlinn, D., … Wagner, H. H. (2019). vegan: community ecology package. R package version 2.5-4. Pinheiro, J., Bates, D., DebRoy, S., & Sarkar, D. (2018). nlme: Linear and nonlinear mixed effect models. R package version 3.1-131.1. Quast, C., Pruesse, E., Yilmaz, P., Gerken, J., Schweer, T., Yarza, P., … Glöckner, F. O. (2013). The SILVA ribosomal RNA gene database project: improved data processing and web-based tools. Nucleic Acids Research, 41(Database issue), D590–D596. doi:10.1093/nar/gks1219 Quimby, D. C., & Johnson, D. E. (1951). Weights and measurements of Rocky Mountain elk. Journal of Wildlife Management, 15, 57–62. R Core Team. (2017). R: A language and environment for statistical computing. R Foundation for Statistical Computing, Zurich, Switzerland. R Core Team. (2019). R: A language and environment for statistical computing. Vienna, Austria: R Foundation for Statistical Computing. Rime, T., Hartmann, M., Brunner, I., Widmer, F., Zeyer, J., & Frey, B. (2015). Vertical distribution of the soil microbiota along a successional gradient in a glacier forefield. Molecular Ecology, 24(5), 1091–1108. doi:10.1111/mec.13051 Risch, A. C., Jurgensen, M. F., & Frank, D. A. (2007). Effects of grazing and soil micro-climate on decomposition rates in a spatio-temporally heterogeneous grassland. Plant and Soil, 298(1–2), 191–201. doi:10.1007/s11104-007-9354-x Schloss, P. D., Westcott, S. L., Ryabin, T., Hall, J. R., Hartmann, M., Hollister, E. B., … Weber, C. F. (2009). Introducing mothur: open-source, platform-independent, community-supported software for describing and comparing microbial communities. Applied and Environmental Microbiology, 75(23), 7537–7541. doi:10.1128/AEM.01541-09 Smith, D., Stahler, D., Cassidy, K., Stahler, E., Metz, M., Cassidy, B., … Cato, E. (2018). Yellowstone National Park wolf project annual report 2017. Yellowstone National Park, Mammoth, WY, USA: National Park Service, Yellowstone Center of Resources. Wang, Q., Garrity, G. M., Tiedje, J. M., & Cole, J. R. (2007). Naive Bayesian classifier for rapid assignment of rRNA sequences into the new bacterial taxonomy. Applied and Environmental Microbiology, 73(16), 5261–5267. doi:10.1128/AEM.00062-07 Withington, C., & Sanford Jr., R. (2007). Decomposition rates of buried substances increase with altitude in a forest-alpine tundra ecotone. Soil Biology and Biochemistry, (39), 68–75. Please cite this paper together with the citation for the datafile.12 years ago
- The data results from a questionnaire survey conducted at 8 schools in the cantons Zurich, Aargau and St. Gallen. Respondents aged 13-22 years. The aim of the survey was to gain insight into teenagers' relationship to the forest, reasons for visiting or not visiting the forest and activities in the forest.42 years ago
- Debris-flow bulk volumes from the WSL monitoring station. More information can be found in McArdell et al. (2007) and Schlunegger et al. (2009).12 years ago
- The lateral transport of heat above abrupt (sub-)metre-scale steps in land surface temperature influences the local surface energy balance. We present a novel experimental method to investigate the stratification and dynamics of the near-surface atmospheric layer over a heterogeneous land surface. Using a high resolution thermal infrared camera pointing at synthetic screens, a 30Hz sequence of frames is recorded. The screens are deployed upright and horizontally aligned with the prevailing wind direction. The screen’s surface temperature serves as a proxy for the local air temperature. We developed a method to estimate near-surface two-dimensional wind fields at centimetre resolution from tracking the air temperature pattern on the screens. Wind field estimations are validated with near-surface three-dimensional short-path ultrasonic data. To demonstrate the capabilities of the screen method, we present results from a comprehensive field campaign at an alpine research site during patchy snow cover conditions. The measurements reveal an extremely heterogeneous near-surface atmospheric layer. Vertical profiles of horizontal and vertical wind speed reflect multiple layers of different static stability within 2m above the surface. A dynamic, thin stable internal boundary layer (SIBL) develops above the leading edge of snow patches protecting the snow surface from warmer air above. During pronounced gusts the warm air from aloft entrains into the SIBL and reaches down to the snow surface adding energy to the snow pack. Measured vertical turbulent sensible heat fluxes are shown to be consistent with air temperature and wind speed profiles obtained using the screen method and confirm its capabilities to investigate complex in situ near-surface heat exchange processes. Here you find the data and the documented code used to create the plots in the publication.32 years ago
- Silvopastoral systems are highly productive and combine long-term wood production with annual provision of forage for livestock. In the Swiss Jura Mountains these systems are a key component of the landscape. As in other cold biomes, climate change can potentially accelerate landscape change within these historically sustainable systems. In order to anticipate the evolution of subalpine wooded pasture ecosystems under future climate and land-use changes, this project focused on the interplay between soil, vegetation and climate. It was aimed at providing experimental evidence for chief ecosystem processes, with emphasis on the quality of the ecosystem services provided. The main interest was placed on vegetation turf resistance to climate change along an unwooded – sparsely wooded - densely wooded pasture gradient (land-use intensity), where plant productivity, diversity and succession along with rates of carbon cycling and microbial activity provided measures of ecosystem functioning at both plot and landscape level. Experimental transplantation of monolith soil turfs to lower altitudes allowed to simulate soil warming and reduced annual precipitation. In order to simulate a year-round warmer and drier climate the natural climate variation along an altitudinal gradient was used as a proxy. The aim was to simulate realistic climate change scenarios for the second half of the 21st century predicted by the IPCC report and downscaled for Switzerland providing regionalized interpolated projections integrating therein trends for temperature increase and precipitation decrease. By using permanent meteorological stations within the network of the Federal Office of Meteorology and Climatology (MeteoSwiss), we obtained high resolution regional data on the variation of mean annual temperature (MAT) and mean annual precipitation (MAP) in relation to altitude in the Swiss Jura Mountains. We observed a general increase of +0.5 K in MAT and a decrease of -20 % MAP for each 100 m decrease in altitude along the SE slope of the Swiss Jura Mountains. These relationships served for the selection of the transplantation sites such that in comparison to a control site at 1350 m a.s.l. (Combe des Amburnex, N 46°54’, E 6°23’) a +2 K MAT and -20 % MAP was achieved at 1010 m a.s.l. (Saint-George, N 46°52’, E 6°26’), a +4 K MAT and -40 % MAP at 570 m a.s.l., (Arboretum d’Aubonne, N 46°51’, E 6°37’), and a +5 K MAT and -50 % MAP at 395 m a.s.l. (Les Bois Chamblard, N 46°47’, E 6°41’). The two stations at 1010 m a.s.l. and 570 m a.s.l. corresponded to the IPCC scenario A1B for a moderate increase in greenhouse gas emissions and to scenario A2 for a high increase in greenhouse gas emissions, respectively. The station at 395 m a.s.l. was chosen to represent an extreme scenario with climate variables lying at the positive tail distribution of model predictions under the A2 scenario. Soil cores were assembled into rectangular PVC boxes of 60 80 cm2 size and of 35 cm height. All mesocosms were dug down to surface level into previously prepared trenches in the ground thus preventing lateral heat exchange with the atmosphere. Since at each site the mesocosms were placed in a common garden with no light interception, mesocosms with turfs from the two wooded pastures were shaded from direct sun light to simulate the natural light conditions in the corresponding habitats. Each mesocosm was equipped with a drainage system and was connected to a water tank thus representing a zero potential lysimeter collecting soil solution and precipitation/snowmelt runoff. ECH2O EC-TM sensor probes coupled to Em50 data-loggers (Decagon Devices, Inc., USA) recorded soil temperature and volumetric water content in each mesocosm at the top-soil (0 to -3 cm) every minute and data were averaged over one hour intervals. Climate parameters at each transplantation site were monitored continuously throughout the experiment by means of automated weather stations (Sensor Scope Sàrl, Switzerland), measuring rain precipitation (non-heated tipping bucket gauges) and air temperature and humidity 2 m above the ground surface at one minute intervals. A list of above- and belowground variables were measured to assess the resilience of biogeochemical processes, plant productivity, tree regeneration, and carbon sequestration for each respective land-use practice. Furthermore, the experimental data were used to improve on (parameterization) the existing spatially explicit, dynamic model WoodPaM and refine the modelʼs climatic and land-use variables so that different scenarios of climate change and land use change could be simulated. Natural and management induced disturbance patterns were incorporated into the model. The data have been made available within the project CCES Mounted. The climate stations Sensorscope are still in use within the project CLIMARBRE (Wald und Klimawandel, WSL/BAFU). #References 1. Puissant, J., Cécillon, L., Mills, R.T.E., Robroek, B.J.M. Gavazov, K., De Danieli, S., Spiegelberger, T., Buttler, A., Brun, J.J. 2015. Seasonal influence of climate manipulation on microbial community structure and function in mountain soils. Soil Biology and Biochemistry 80: 296–305. 2. Mills, R., K. Gavazov, T. Spiegelberger, D. Johnson and A. Buttler 2014. Diminished soil functions occur under simulated climate change in a sup-alpine pasture, but heterotrophic temperature sensitivity indicates microbial resilience. Science of the Total Environment, vol. 473–474(0): 465-472. 3. Gavazov, K., Spiegelberger, T. and Buttler, A. 2014. Transplantation of subalpine wood-pasture turfs along a natural climatic gradient reveals lower resistance of unwooded pastures to climate change compared to wooded ones. Oecologia (174) : 1425-1435. 4. Peringer A., Siehoff S., Chételat J., Spiegelberger T., Buttler A. & Gillet F. 2013. Past and future landscape dynamics in pasture-woodlands of the Swiss Jura Mountains under climate change. Ecology and Society, 18, 3: 11. DOI: 10.5751/ES-05600-180311. [online] URL: http://www.ecologyandsociety.org/vol18/iss3/art11/ 5. Gavazov, K. S., A. Peringer, A. Buttler, F. Gillet and T. Spiegelberger. 2013. Dynamics of Forage Production in Pasture-woodlands of the Swiss Jura Mountains under Projected Climate Change Scenarios. Ecology and Society 18 (1): 38. [online] URL: http://www.ecologyandsociety.org/vol18/iss1/art38/12 years ago
- These data were used to drive and evaluate Jules Investigation Model (JIM) snow simulations. The data provided are the forcing data used for the "deterministic" runs as described in Winstral et al., 2019. The bias-detecting ensemble (Winstral et al., 2019) used observed snow depths (HS) to detect biases in these deterministic simulations related to precipitation and energy inputs to JIM. Simulations that included the BDE evaluations substantially improved JIM simulations.42 years ago
- ## Study Aim We collected these data to alternatively train and validate high resolution (~ 90 m) Species Distribution Models (SDMs) and Species Abundance Models (SAMs) for _Betula nana_ L. (dwarf birch, Betulaceae) and _Salix glauca_ L. (grey willow, Salicaceae) in Southwest Greenland to assess how well such models can predict local-scale patterns. ## Data Description Individual (presence-absence, abundance, maximum vegetative height) and community (species composition, maximum canopy height) shrub data for two fjords near Nuuk, Southwest Greenland. Also provided are corresponding downscaled climate data as well as calculated topographic and terrain wetness indicator variables. ### Nuup Kangerlua (Godthåbsfjord) _Betula nana_ and _Salix glauca_ presence-absence, abundance, community species richness ### Kangerluarsunnguaq (Kobbefjord) Shrub presence-absence, abundance, maximum vegetative height, community composition, maximum shrub canopy height ## Methods ### Field survey in Nuup Kangerlua We conducted a stratified systematic plant survey along the length of Nuup Kangerlua (NK) fjord in Soutwesth Greenland (Fig. 1 in Chardon et al. 2022; following Nabe-Nielsen et al., 2017). At five distinct sites, we sampled along elevational gradients to collect data on presences, absences, abundance, and species composition of all woody species using a 0.7 x 0.7 m pin-point frame (Fig. 1e in Chardon et al. 2022). For model training, we converted these pin-point data to percent cover estimates based on the number of pins dropped (n = 25 per plot) and averaged them across the 119 spatio-climatic grids (see next section) corresponding to the plot locations (for details see Appendix S2 in Chardon et al. 2022). ### Field survey in Kangerluarsunnguaq We conducted a random stratified plant survey in Kangerluarsunnguaq (K) fjord in Southwest Greenland. We used a preliminary Species Abundance Model trained with summed pin counts of _Betula nana_ in NK fjord (see Fig. S1.3 in Chardon et al. 2022) to stratify the ~ 27 x 17 km fjord landscape into low, medium, and high abundances classes. We randomly selected 90 x 90 m spatio-climatic grids to survey in each class for a total of 200 grids, ensuring that they were accessible by foot or boat (for details see Appendix S2 in Chardon et al. 2022). Within each grid, we sampled within three 1 m2 quadrats arranged in a randomly rotated equilateral triangle centered on the mid-point of the cell. We used a gridded sampling quadrat with 1% delineations (Fig. 1h in Chardon et al. 2022) to record woody species presences, absences, and composition, estimated percent cover, and measured maximum shrub species vegetatitve height. At every plot, we also visually scanned the area in a 20 m radius from the plot and recorded the presence of any additional shrub species to estimate grid-level species richness. As in NK fjord, we averaged these data at the grid level (for details see Appendix S2 in Chardon et al. 2022). ### Biotic variables We calculated biotic microscale variables from the plant survey data collected in NK and K fjords. We calculated shrub species richness, diversity, and competition (i.e. sum of non-B. nana or non-S. glauca pin hits or percent cover). In K fjord, we also calculated canopy height as the community weighted mean (by abundance) of maximum vegetative shrub height. ### Climate variables We computed high resolution temperature, precipitation, and insolation for local scale data for the study area by statistically downscaling climate time series (1982 - 2013) from the monthly CHELSA data (Karger et al. 2017). We downscaled these data from 30 arc sec (~ 400 m at the latitude of our study) to our target grid size of ~ 90 m with geographic weighted regression and using the MEaSUREs Greenland Ice Mapping Project (GIMP) Digital Elevation Model (DEM) v. 1 (Howat et al., 2014, 2015). We then calculated 30-year averages of the climate parameters: average summer (June – August) maximum temperature, yearly maximum temperature, yearly minimum temperature, temperature continentality (yearly max. - min. temperatures), cumulative Spring (March – May) precipitation, cumulative summer precipitation, and average summer incident solar radiation (henceforth, insolation) (for calculation details see Appendices S2, S3 in Chardon et al. 2022 and Appendix S2 in von Oppen et al. 2021). ### Topography and terrain wetness indicator variables We calculated several topographic and terrain wetness indices at a local scale. We derived slope, aspect, and the SAGA wetness index (hereafter TWI; Boehner et al., 2002; Boehner and Selige, 2006) from the GIMP DEM. TWI is a measure of how ‘wet’ an area is, based on water drainage from the surrounding landscape. We also calculated the tasseled cap wetness component (hereafter TCW, Crist and Cicone 1984) from satellite images (for details see Appendices S2, S3 in Chardon et al. 2022) as an alternative measure of wetness. ### Computer code Attached as zip file and available on GitLab (https://gitlab.com/nathaliechardon/gl_microclim) ### Third-party data Data used to calculate climate, topography, and terrain wetness indicator variables are publicly available (see Appendix S2 in Chardon et al. 2022 for all data references).32 years ago
- Assessment of coarse woody debris on LWF plots using full count methods on defined subplots (applying ForestBiota protocoll) ### Purpose: ### Assessing the amount of coarse woody debris ### Manual Citation: ### * Franziska Heinrich, 2005: Totholz-Aufnahme mit ForestBIOTA Protokoll. Langfristige Waldökosystem-Forschung LWF. Eidg. Forschungsanstalt WSL, Birmensdorf, 7 S. * ForestBiota, 2005. Stand structure assessment including deadwood. EU/ICP Forests Biodiversity Test-Phase (ForestBIOTA). [>>>](http://www.forestbiota.org) * Fischer, R., Fischer, R., Seidling, W., Granke, O., Meyer, P., Stofer, S., Travaglini, D., 2007. ForestBIOTA – Testphase zur Erfassung der biologischen Vielfalt. AFZ/Wald 62, 1070. ### Paper Citation: ### * Seidling, W., Travaglini, D., Meyer, P., Waldner, P., Fischer, R., Granke, O., Chirici, G., Corona, P., 2014. Dead wood and stand structure - relationships for forest plots across Europe. IForest - Biogeosciences and Forestry 7, 269-281.12 years ago
- Aerosol properties were measured between February 8 and March 31 2019 at the measurement site Davos Wolfgang (LON: 9.853594, LAT: 46.835577). Optical and aerodynamic particle counters, as well as a scanning mobility particle size spectrometer and an ice nuclei counter were deployed to report particle concentrations and size distributions in fine (10-1000 nm) and coarse mode (> 1000 nm), cloud condensation nuclei concentrations (CCNCs) and ice nuclei particle concentrations (ICNCs). The ambient particles were transported via a heated inlet to be distributed to the particle detecting devices inside the setup room. Optical Particle Counter (OPC): Light scattering of a diode laser beam caused by travelling particles is used in the both, the OPC-N3 (0.41 - 38.5 μm) and GT-526S (0.3 – 5 μm), to determine their size and number concentration. For the OPC-N3, particle size spectra and concentration data are used afterwards to calculate PM₁, PM₂,₅ and PM₁₀ (assumptions: particle density: 1.65 g cmˉ³, refractive index: 1.5+i0). Aerodynamic Particle Sizer (APS): The APS (3321, TSI Inc.) measured the particle size distribution for aerodynamic diameters between 0.5 μm and ~20 μm by the particle’s time-of-flight and light-scattering intensity (assumptions: particle density 1 g cmˉ³). Scanning Mobility Particle Size Spectrometer (SMPS): Particle number concentrations in a size range between 12 and 460 nm (electrical mobility diameter) were measured at Davos Wolfgang, using a Scanning Mobility Particle Sizer Spectrometer (3938, TSI Inc.). The classifier (3082, TSI Inc.) was equipped with a neutralizer (3088, TSI Inc.) and a differential mobility analyzer working with negative polarity (3081, TSI Inc.). The size selected particles were counted by a water-based condensation particle counter (3788 , TSI Inc.). The TSI AIM software was used to provide particle size distributions by applying multiple charge and diffusion loss corrections (assumptions: particle density 1 g cmˉ³). Coriolis μ and DRINCZ: A microbial air sampler (Coriolis μ, bertin Instruments) was used to collect airborne particles for investigating their ice nucleating ability with a droplet freezing device. Particles larger than 0.5 μm were drawn with an air flow rate of up to 300 l minˉ¹ into the cone and centrifuged into the wall of the cone due to the forming vortex. The liquid sample was transferred into the DRoplet Ice Nuclei Counter Zurich (DRINCZ, ETH Zurich) to study heterogeneous ice formation (immersion freezing mode) of ambient airborne particles.52 years ago
- The Swiss Federal Research Institute WSL has extensive experience with surrogate bedload transport measurements. The first measuring site was established in the Erlenbach stream, a small (first-order) catchment in the pre-alpine valley Alptal in central Switzerland. Continuous bedload transport measurements were started in 1986, using first piezoelectric sensors (1986 to 1999) and then geophone sensors (from 2002 onwards) underneath a steel plate and mounted flush with the streambed. In the meantime, the so-called Swiss plate geophone (SPG) system has been installed at more than 20 field sites, primarily in smaller and steeper streams in Switzerland, Austria, and Italy but also in a few larger rivers and in some other streams worldwide (Israel, USA, Japan). Sediment transport observations in Switzerland with the SPG system concern the following streams: Erlenbach near Brunni (Alptal valley), Albula at Tiefencastel, Navisence at Zinal, Avançon de Nant near Pont de Nant (see map). The data in this repository primarily refer to calibration measurements with the SPG system. The publications listed here discuss primarily the performance of the measuring system but also process-based aspects of bedload transport.102 years ago
- Volume of stemwood with bark of all living and dead trees and shrubs (standing and lying) starting at 12 cm dbh. This corresponds to the sum of the volumes of growing stock and deadwood. The correction for bias with the sample Tarif trees may be so drastic that it results in negative values with small numbers of trees. __Citation:__ > _Abegg, M.; Brändli, U.-B.; Cioldi, F.; Fischer, C.; Herold-Bonardi, A.; Huber M.; Keller, M.; Meile, R.; Rösler, E.; Speich, S.; Traub, B.; Vidondo, B. (2014). Fourth national forest inventory - result tables and maps on the Internet for the NFI 2009-2013 (NFI4b). [Published online 06.11.2014] Available from World Wide Web http://www.lfi.ch/resultate/ Birmensdorf, Swiss Federal Research Institute WSL. [doi:10.21258/1057112](https://doi.org/10.21258/1057112)_32 years ago
- Dry weight (mass) of all deadwood. This consists of the standing dead trees and shrubs starting at 12cm dbh and the lying deadwood starting at 7cm in diameter. __Citation:__ > _Abegg, M.; Brändli, U.-B.; Cioldi, F.; Fischer, C.; Herold-Bonardi, A.; Huber M.; Keller, M.; Meile, R.; Rösler, E.; Speich, S.; Traub, B.; Vidondo, B. (2014). Fourth national forest inventory - result tables and maps on the Internet for the NFI 2009-2013 (NFI4b). [Published online 06.11.2014] Available from World Wide Web http://www.lfi.ch/resultate/ Birmensdorf, Swiss Federal Research Institute WSL. [doi:10.21258/1057112](https://doi.org/10.21258/1057112)_22 years ago
- Number of regeneration trees starting at 10 cm height up to 11.9 cm dbh with a particular type of damage or with no damage. The attribute is recorded by targeting the next regeneration tree in the centre of the subplot during NFI’s regeneration survey. A regeneration tree may have more than one type of damage, which means it may contribute to the total number of regeneration trees for several different types of damage. __Citation:__ > _Abegg, M.; Brändli, U.-B.; Cioldi, F.; Fischer, C.; Herold-Bonardi, A.; Huber M.; Keller, M.; Meile, R.; Rösler, E.; Speich, S.; Traub, B.; Vidondo, B. (2014). Fourth national forest inventory - result tables and maps on the Internet for the NFI 2009-2013 (NFI4b). [Published online 06.11.2014] Available from World Wide Web http://www.lfi.ch/resultate/ Birmensdorf, Swiss Federal Research Institute WSL. [doi:10.21258/1057112](https://doi.org/10.21258/1057112)_22 years ago
- SnowMicroPen (SMP) measurements and manual snowpits from Dronning Maud Land, East Antarctica. Measurements were taken in the vicinity of the Belgium Princess Elisabeth Station (PEA), in a transect towards the coast, and on the Lokeryggen and Hammarryggen Ice Rises near the coast. Measurements were taken during 3 individual campaigns in the 2016-2017, 2018-2019 and 2019-2020 field seasons.62 years ago
- Assessment of damges, i.e. symptoms, extent and causes on trees. ### Purpose: ### Occurrence and extent of diseases ### Manual Citation: ### * Matthias Dobbertin, Christian Hug, Andreas Schwyzer, Serge Borer, Hanna Schmalz, 2016: Aufnahmeanleitung Kronenansprachen auf den Sanasilva- und den LWF-Flächen (Version 10). Sanasilva Inventur und Langfristige Waldökosystem-Forschung, Birmensdorf, 86 S. [>>>](https://www.wsl.ch/fileadmin/user_upload/WSL/Wald/Waldentwicklung_Monitoring/LWF/Sanasilva/ssi_anleitung_v10_extern.pdf) * Eichhorn J, Roskams P, Potocic N, Timmermann V, Ferretti M, Mues V, Szepesi A, Durrant D, Seletkovic I, Schröck H-W, Nevalainen S, Bussotti F, Garcia P, Wulff S, 2016: Part IV: Visual Assessment of Crown Condition and Damaging Agents. In: UNECE ICP Forests Programme Co-ordinating Centre (ed.): Manual on methods and criteria for harmonized sampling, assessment, monitoring and analysis of the effects of air pollution on forests. Thünen Institute of Forest Ecosystems, Eberswalde, Germany, 49 p. + Annex [>>>](https://www.icp-forests.org/pdf/manual/2016/ICP_Manual_2017_02_part04.pdf ) ### Paper Citation: ### * Michel A, Seidling W, Prescher A K (2018) Forest Condition in Europe. 2018 Technical Report of ICP Forests. Report under the UNECE Convention on Long-Range Transboundary Air Pollution (CLRTAP). BFW-Dokumentation 25/2018, BFW Austrian Research Centre for Forests, Vienna, 92 p. [>>>](http://icp-forests.net/page/icp-forests-technical-report) * Köhl M, San-Miguel-Ayanz J, Cools N, de Vos B, Fischer R, Camia A, Granke O, Hiederer R, Lorenz M, Montanarella L, Mues V, Nagel H-D, Poker J, Scheuschner T, Schlutow A (2011) Maintenance of Forest Ecosystem Health and Vitality. State of Europe s forests: status and trends in sustainable forest management in Europe 29-49. [>>>](http://www.foresteurope.org/documentos/State_of_Europes_Forests_2011_Report_Revised_November_2011.pdf) * Brang P., 1998: Sanasilva-Bericht 1997. Zustand und Gefährdung des Schweizer Waldes – eine Zwischenbilanz nach 15 Jahren Waldschadenforschung. Berichte der Eidg. Forschungsanstalt für Wald, Schnee und Landschaft, Vol. 345. Eidg. Forschungsanstalt WSL, Birmensdorf, 102 S. [>>>](https://www.dora.lib4ri.ch/wsl/islandora/object/wsl:14555)12 years ago
- We developed a map of cropland and grassland allocation for Switzerland based on several indices dominantly derived from Sentinel-2 satellite imagery captured over multiple growing seasons. The classification model was trained based on parcel-based data derived from landholder reporting. The mapping was conducted on Google Earth Engine platform using random forest classifier. Areas of high vegetation, shrubland, sealed surface and non-vegetated areas were masked out from the country-wide map. The resulting map has high accuracy in lowlands as well as mountainous areas.102 years ago
- Since 1997 soil solution samplers are installed in certain plots of the Intercantonal Forest Observation Program *[Intercantonal Forest Observation Program](https://www.envidat.ch/dataset/interkantonale-walddauerbeobachtung-wdb)*. There solution is analysed monthly at the moment (2023) in 46 Swiss forest sites. The sites cover a uniquely broad range of Swiss forest soils, with gradients in elevation (290-1870 m), precipitation (915-2211 mm), base saturation averaged over the top 40 cm (6-100%) and total N deposition (10-81 kg ha⁻¹a⁻¹). For each site and soil depth, eight soil solution samplers (ceramic suction cup) are installed in the topsoil and five in the subsoil. Actual depths varied according to soil condition but a frequent sampling design is 20, 50 and 80 cm. Following the monthly sampling of the soil solution, the samples from the same location and from the same depth are pooled. Monthly data about following chemical soil solution indicators are measured: * pH and conductivity * Anions: Cl⁻, NO₃⁻, SO₂⁻ * Kations: Ca²⁺, Mg²⁺, K⁺, Na⁺, Mn²⁺, NH4⁺, Altot, Alorg * DOC More information about the analytical methods and results can be found in *[Braun & Tresch (2020)](https://doi.org/10.1371/journal.pone.0227530)*. The long-term measurements of the soil solution provide the basis for revealing changes in forest soil quality. The chemical composition of the soil solution allows comparison and assessment of internationally agreed critical values and criteria on acid-base status (indicators: BC/Al ratio, pH value, N concentrations in the soil solution) as well as the leaching of N, Al and basic cations.12 years ago
- This dataset contains all data on which the following publication below is based. Paper Citation: Frey B., Maurer C., Schneider K. (2023) Informationen zum Boden anhand der Gebundenheit der Rote-Liste Arten BAFU. Bundesamt für Umwelt BAFU. 26 p. Please cite this paper together with the citation for the datafile. Soil is the habitat and basis of life for countless creatures. The great importance of soil organisms for the fertility of our soils is widely recognized, but information is sparse on their distribution and possible endangerment in Switzerland. In the present project, target species, i.e. species that are closely linked to the soil, were identified, and for the the first time, information was gathered on the degree of endangerment of the soil ecosystem in Switzerland on the basis of Red List species. For eleven Red List groups, the species' soil dependency was determined, i.e. whether their life cycle includes stages in or on the soil. The assessment of soil dependency was made using four classes, which enabled the classification not only of insects but also of vertebrates, land snails, lichens and fungi.32 years ago
- The forest area is the total sum of all areas classified as forest according to NFI’s forest definition. The forest definition includes shrub forest. This theme is also used to assess the total area when forest and non-forest need to be distinguished. __Citation:__ > _Abegg, M.; Brändli, U.-B.; Cioldi, F.; Fischer, C.; Herold-Bonardi, A.; Huber M.; Keller, M.; Meile, R.; Rösler, E.; Speich, S.; Traub, B.; Vidondo, B. (2014). Fourth national forest inventory - result tables and maps on the Internet for the NFI 2009-2013 (NFI4b). [Published online 06.11.2014] Available from World Wide Web http://www.lfi.ch/resultate/ Birmensdorf, Swiss Federal Research Institute WSL. [doi:10.21258/1057112](https://doi.org/10.21258/1057112)_42 years ago
- Volume of stemwood with bark of all trees and shrubs starting at 12 cm dbh removed from the forest between two inventories due to damage that occurred, in this case windthrow, and not due to silvicultural planning. This theme is derived on the level of a sample plot from the cuttings of the sample trees and the salvage cut proportion (according to information from the forester). The correction for bias with the sample Tarif trees may be so drastic that it results in negative values with small numbers of trees. __Citation:__ > _Abegg, M.; Brändli, U.-B.; Cioldi, F.; Fischer, C.; Herold-Bonardi, A.; Huber M.; Keller, M.; Meile, R.; Rösler, E.; Speich, S.; Traub, B.; Vidondo, B. (2014). Fourth national forest inventory - result tables and maps on the Internet for the NFI 2009-2013 (NFI4b). [Published online 06.11.2014] Available from World Wide Web http://www.lfi.ch/resultate/ Birmensdorf, Swiss Federal Research Institute WSL. [doi:10.21258/1057112](https://doi.org/10.21258/1057112)_22 years ago
Title
Updated